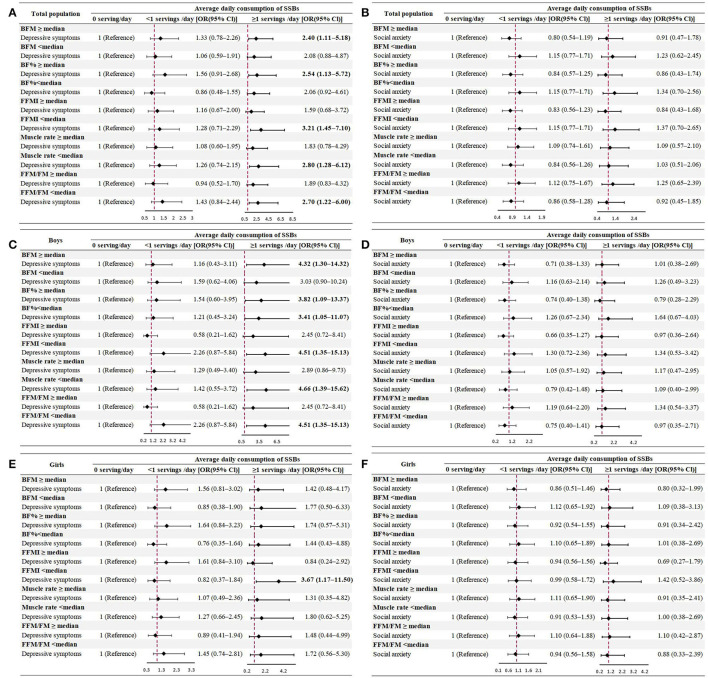
Figure 3.
Multivariate odds ratios (OR) and 95% confidence intervals (CI) of SSB consumption for depression (A,C,E) and social anxiety (B,D,F) symptoms among the total population and each sex group, stratified by body composition (model was adjusted for age, sex, parental educational attainment, maternal smoking status, single-child status, BMI, income, fruit consumption, physical activity, screen time, and the frequency of fried food consumption).

