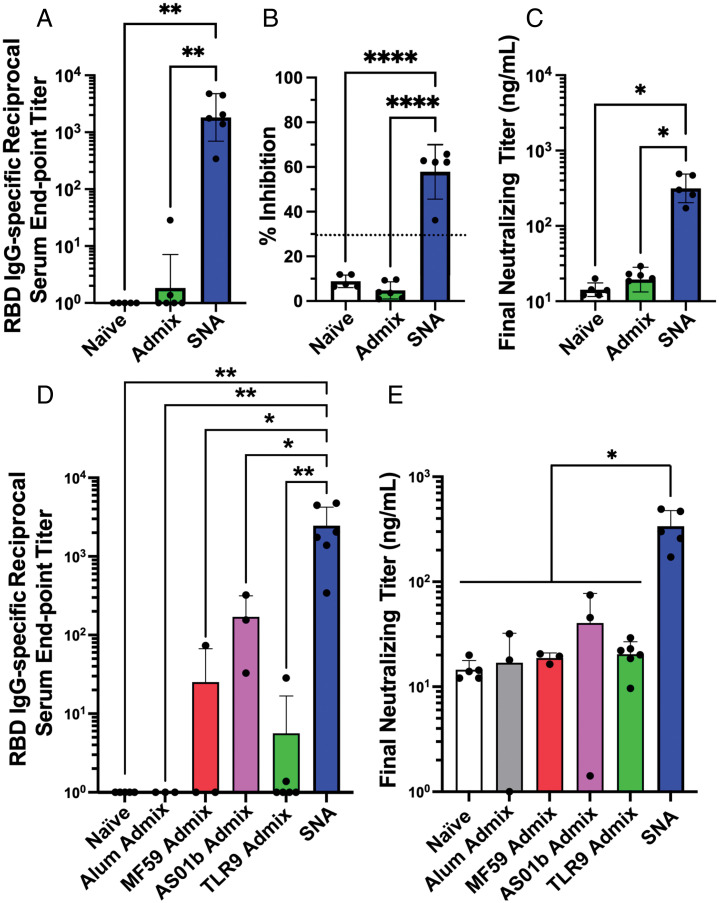
Fig. 2.
SNA structure induces higher levels of antigen-specific binding and neutralizing titers in vivo. (A) Samples were quantified via ELISA for the presence of RBD-specific IgG binding antibodies. Reciprocal serum end point titers were calculated through fitting absorbance at 450-nm values to a four-parameter logistic sigmoidal curve. (B) Sera were employed in a pseudovirus inhibition study and were assessed for the inhibition percentage at a 1:10 sera dilution, or (C) were fit to a standard curve to calculate a final neutralizing titer. Dashed line in B represents threshold cutoff value for positive inhibition according to manufacturer’s protocol. (D) RBD-specific IgG binding antibody measurement of SNA compared with simple mixture immunizations formulated using commercial adjuvants. (E) Final neutralizing titer calculated in a pseudovirus inhibition study and fit to a standard curve. All graphs show mean and SD, n = 3 to 6 per group. Mice were injected with 1.4 nmol by RBD protein and one of the following adjuvants: 44 nmol by CpG DNA (SNA and TLR9 admix groups), 40 μg by Al3+ (Alum admix), 25 μL by AddaVax (MF59 admix), or 4.2 μg by QS21 and MPLA4 (AS01b admix). Dosing can be found in greater detail in In Vivo Immunization in Mice. For A, B, and D, analysis was done using an ordinary one-way ANOVA followed by a Tukey’s multiple comparisons test. For C and E, analysis was done using a Brown–Forsythe ANOVA followed by a Dunnett’s multiple comparisons test. *P < 0.05; **P < 0.01; ****P < 0.0001.

