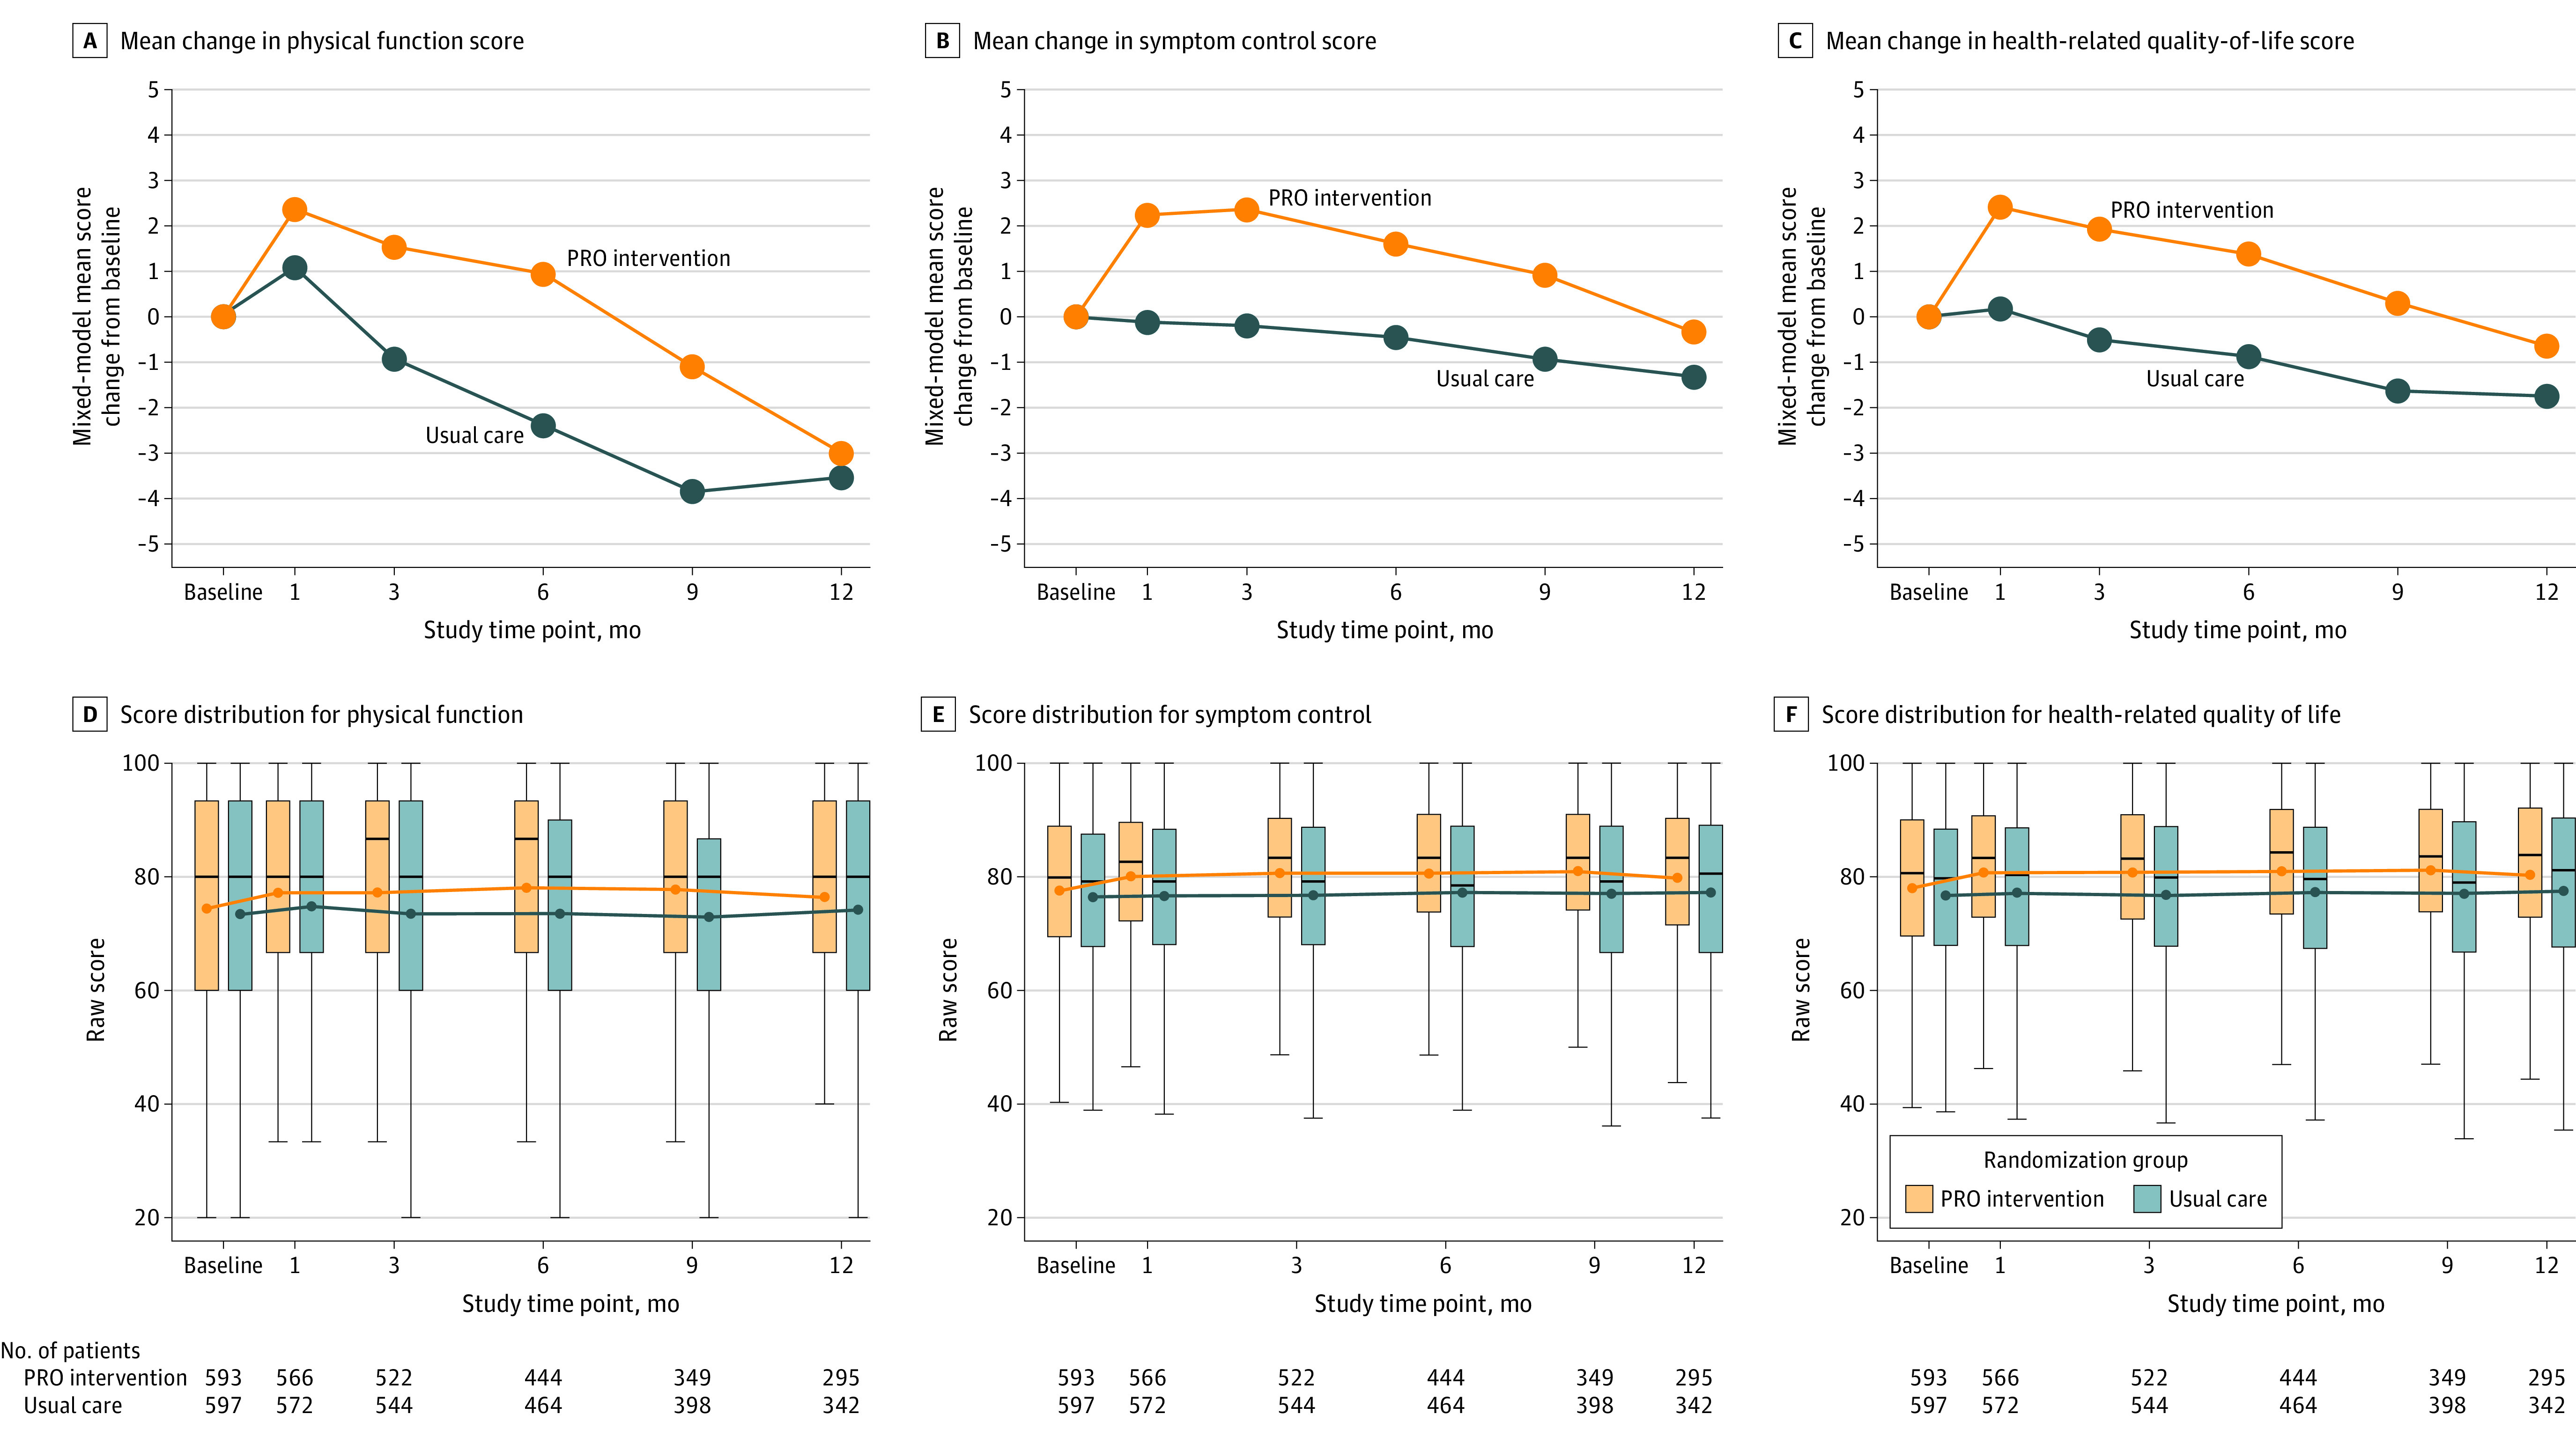
Figure 2. Score Distribution and Model-Based Mean Change From Baseline at Each Assessment Time Point for Physical Function, Symptom Control, and Health-Related Quality of Life.

Scores on the European Organisation for Research and Treatment of Cancer Quality of Life Questionnaire. PRO indicates patient-reported outcome. Positive values represent improvement. In panels A-C, P values for model-based mean change from baseline at 1-, 3-, 6-, 9-, and 12-month assessments, respectively, are as follows: panel A (physical function), P = .21, P = .02, P = .003, P = .02, and P = .68; panel B (symptom control), P = .003, P = .002, P = .02, P = .045, and P = .32; and panel C (health-related quality of life), P = .003, P = .002, P = .006, P = .03, and P = .24. In panels D-F, circles indicate means; horizontal bars, medians; box tops and bottoms, IQRs; and whiskers, 1.5× the IQRs. See eTable 5 in Supplement 2 for point estimates and confidence intervals.
