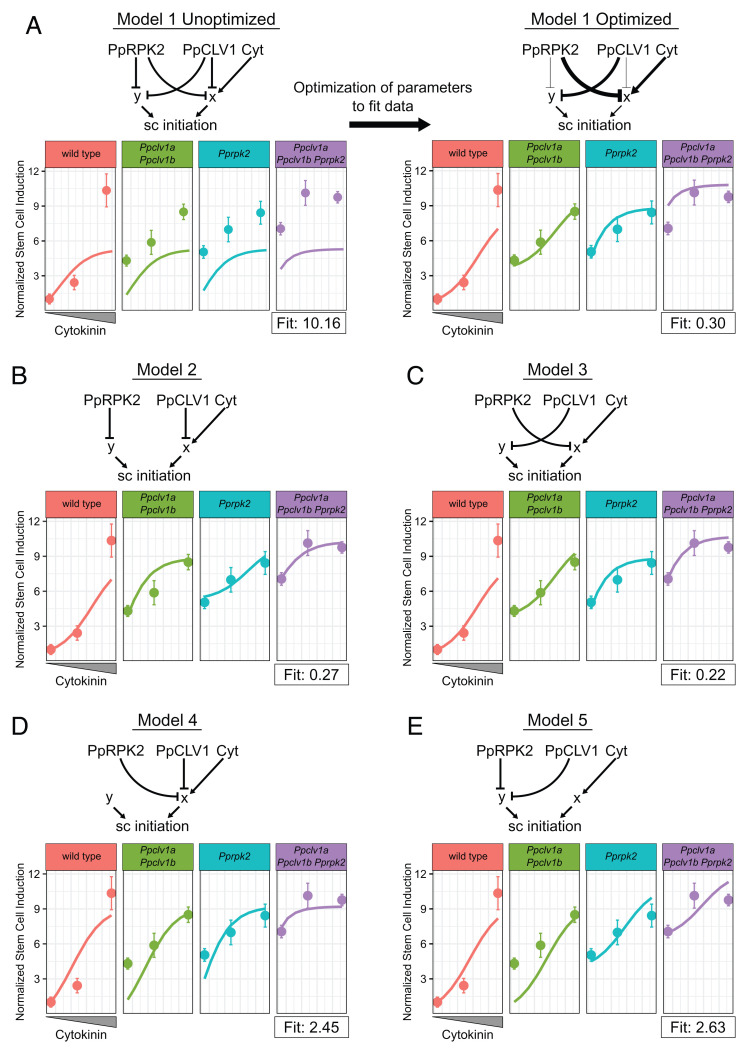
Fig. 4.
Dynamical model simulations of stem cell production by Ppclv1a Ppclv1b and Pprpk2 mutants over a range of cytokinin concentrations. Basic network depictions and simulation results of mathematical models formalizing five different hypotheses: Model 1 PpCLV1 and PpRPK2 are partially redundant (A); model 2 PpCLV1 and PpRPK2 are independent with PpCLV1 upstream of cytokinin response (B); model 3 PpCLV1 and PpRPK2 are independent with PpRPK2 upstream of cytokinin response (C); model 4 PpCLV1 and PpRPK2 are redundant and upstream of cytokinin response (D); and model 5 PpCLV1 and PpRPK2 are redundant and upstream of a cytokinin-independent pathway (E). On plots, solid lines represent simulated data over a range of cytokinin concentrations. Dots with error bars represent the mean empirical stem cells per square micrometer data and SEs. From Left to Right, dots represent values from P. patens grown on mock, 10 nM BAP, and 100 nM BAP. In the model on the Right side of A, the thickness of interaction edges is proportional to the corresponding optimized parameters. Note the empirical data points are based on the data in Fig. 3M.

