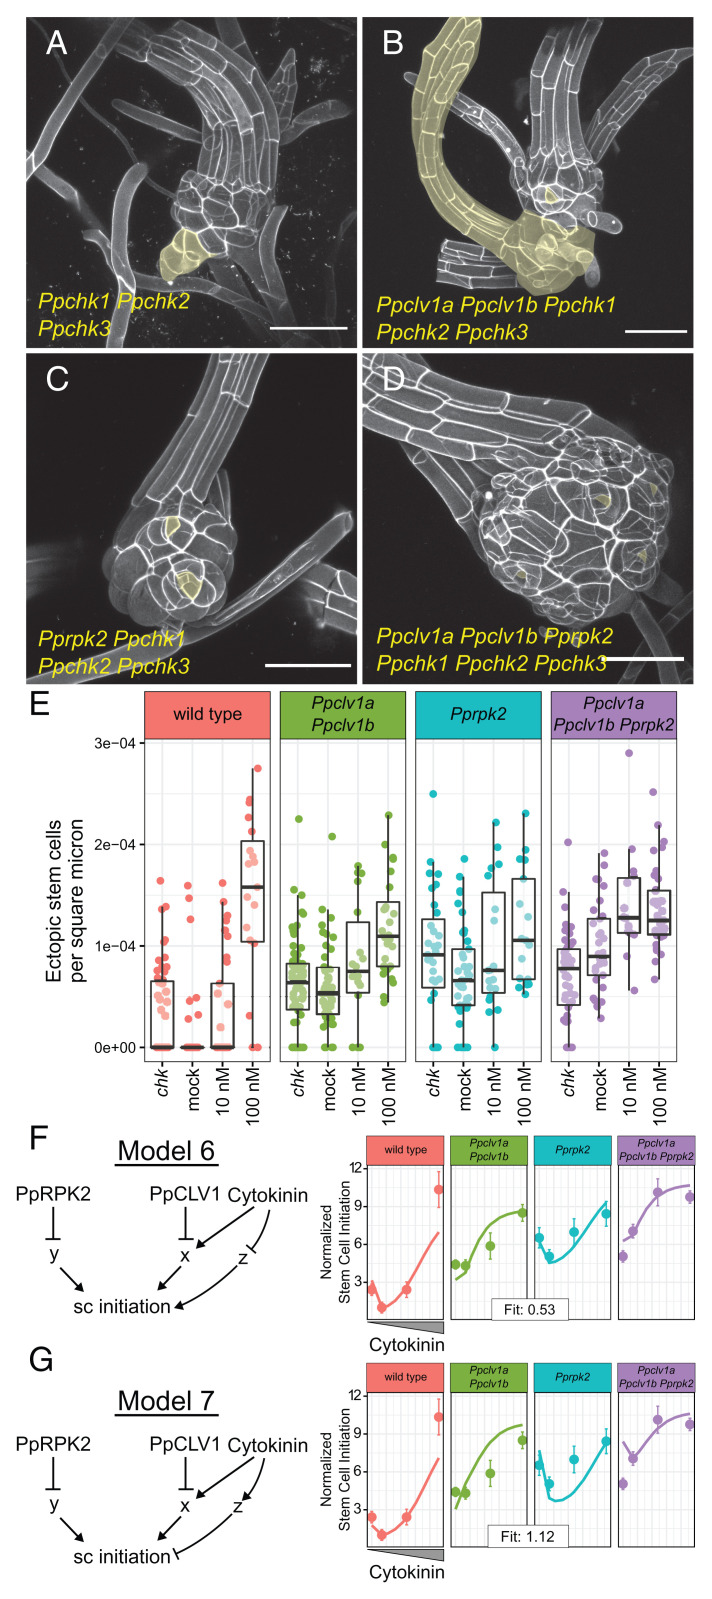
Fig. 5.
Ppchk mutants produce ectopic stem cells and have complex interactions with Ppclv1 and Pprpk2 mutants. Gametophores from 5-wk-old colonies of Ppchk (A), Ppclv1a Ppclv1b Ppchk1 Ppchk2 Ppchk3 quintuple mutants (B), Pprpk2 Ppchk1 Ppchk2 Ppchk3 quadruple mutants (C), and Ppclv1a Ppclv1b Pprpk2 Ppchk1 Ppchk2 Ppchk3 sextuple mutants (D). Ectopic stem cells or derived outgrowths are highlighted in yellow. Quantification of ectopic stem cells per square micrometer of visible stem (E), including data from Fig. 3M. The range of phenotypes quantified are illustrated in SI Appendix, Fig. S7. Model 6 posits that cytokinin inhibits an inducer of stem cell identity (F). In model 7, cytokinin promotes an inhibitor of stem cell specification (G). In F and G, solid lines represent simulated data, while dots represent mean stem cells per area from the empirical data. Error bars show the SE. See Results for statistics from Poisson regression.

