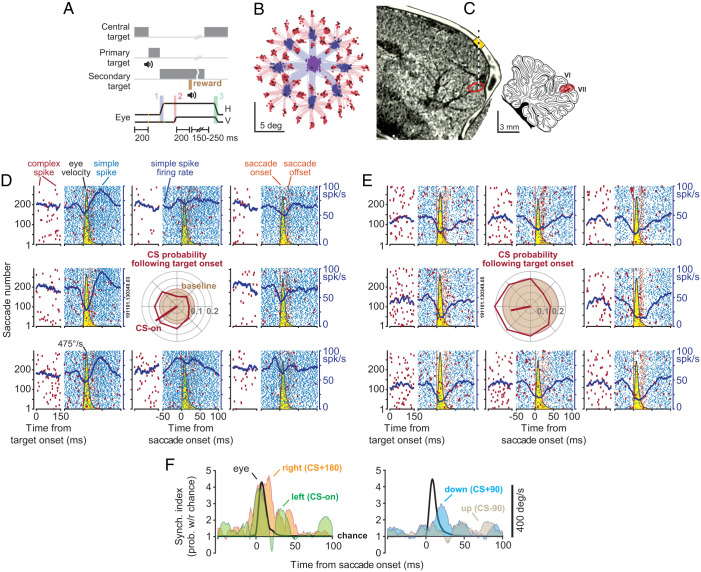
Fig. 1.
P cells synchronized their SSs during saccades. (A) Experimental paradigm. Marmosets were trained to make saccades to visual targets that appeared randomly at one of eight directions. Onset of the primary saccade (labeled 1 in the lowest trace) resulted in the replacement of the primary target with a secondary target, also at a random direction. Following the secondary saccade (labeled 2), and a fixation period, reward was delivered, and the center target was displayed, resulting in a centripetal saccade (labeled 3). (B) Eye position for the primary (blue) and secondary (red) saccades in a typical experiment. (C) We used the MRI and CT images of each animal to guide the electrodes to lobule VI or VII of the cerebellar vermis. (D and E) SCs (blue) and CSs (red) in two simultaneously recorded P cells during saccades to various directions. Eye velocity is shown in yellow. The CSs are also aligned to the onset of the visual target. Both cells exhibited a reduction in SSs during saccades, with a modulation pattern that lasted much longer than the saccade. CS probability during the 200 ms following target onset is quantified via the center subplot. Baseline CS probability is shown by the brown circle. The target direction that produced the highest CS probability (CS-on) is estimated by the red line. (F) Synchronization index during saccades to various directions. This index quantified the probability of synchronization with respect to chance at 1-ms time bins. Eye velocity is indicated by the black curve. Probability of synchronization is greatest for saccades in direction CS+180, reaching a peak at around saccade deceleration.

