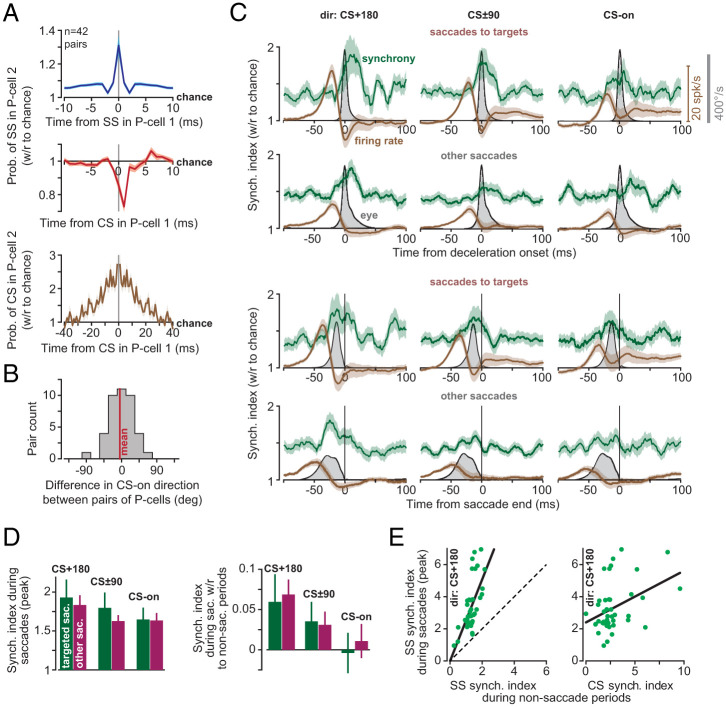
Fig. 4.
P cells synchronized their spikes during saccade deceleration. (A) Probability of spike synchronization in pairs of P cells during the entire recording (41 ± 2 min, mean ± SEM). (Top) Probability of SS in P cell 2 at time point t (with respect to chance), given that an SS occurred in P cell 1 at time 0. (Middle) Probability of SS in P cell 2, given that a CS was produced in P cell 1 at time 0. (Bottom) Probability of CS in P cell 2 given that a CS was produced in P cell 1 at time 0. Bin is 1 ms. (B) Difference in CS-on directions among pairs of simultaneously recorded P cells. (C) Synchronization index (green) and firing rates (brown) for targeted saccades and other saccades. In the first and second rows, data are aligned to deceleration onset. In the third and fourth rows, data are aligned to saccade end. Firing rate is the population response. Bin size is 1 ms. (D) SS synchronization index during saccades (peak value) as a function of direction. (E) (Left) SS synchronization index during saccades (peak value) in direction CS+180, with respect to synchronization index as measured during nonsaccade periods. Dashed line is identity. (Right) Synchronization index during saccades with respect to CS synchronization index as measured during nonsaccade periods (1-ms bin for SS, and 10-ms bin for CS). Error bars are SEM.

