
FIGURE 2.
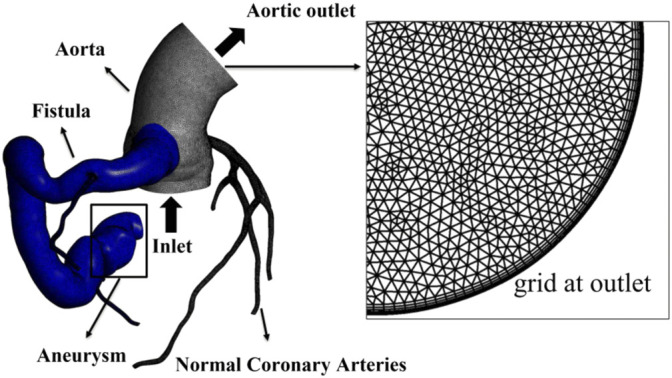
Computational domain and mesh of case 2, with local grid at the aortic outlet showing five boundary layers. The fistula region is indicated by blue part.
Official websites use .gov
A
.gov website belongs to an official
government organization in the United States.
Secure .gov websites use HTTPS
A lock (
) or https:// means you've safely
connected to the .gov website. Share sensitive
information only on official, secure websites.
Computational domain and mesh of case 2, with local grid at the aortic outlet showing five boundary layers. The fistula region is indicated by blue part.