. 2022 Jun 6;12(26):16561–16569. doi: 10.1039/d2ra02307e

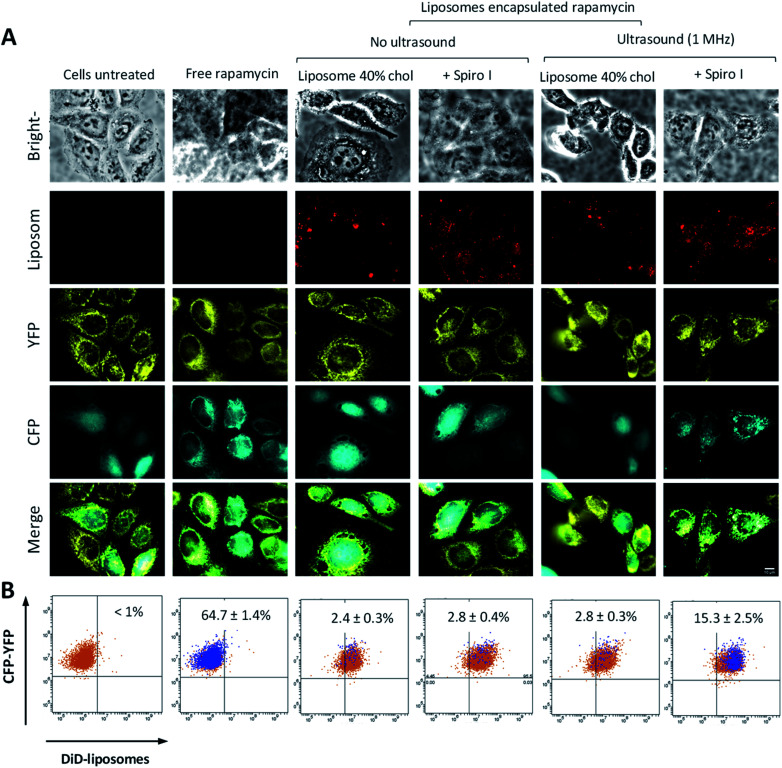
Fig. 5. (A) Fluorescence microscopy of reporter cell system co-expressing α-CFP-FKBP (cyan) and YFP-FRB (yellow) following exposure to different treatments, as indicated above the images; ‘ultrasound’ denotes that cells were exposed to 1 MHz ultrasound continuously for 6 minutes. (B) Flow cytometry dot plots of FRET effect for reporter cell system following different treatments – these correspond to microscopy image above. Orange dots above the horizontal line positioned in upper left quadrant indicate cells showing fluorescence from α-CFP-FKBP and Mito-YFP-FRB, blue dots above the horizontal line positioned in upper left quadrant indicate cells showing FRET from α-CFP-FKBP and YFP-FRB pair, orange dots above the horizontal line and positioned right of vertical line in right upper quadrant indicate cells showing both α-CFP-FKBP and Mito-YFP-FRB fluorescence as well as internalization of DiD labelled liposomes, ‘overlap’ of orange and blue dots in upper right quadrant indicates cells that show both internalization of liposomes and FRET effect of CFP-FKBP and YFP-FRB pair driven by the presence of free rapamycin in the cytoplasm. Percentage of cells in population showing FRET is reported in each dot plot. The flow cytometry gating strategy illustrated in ESI..

Fig. 5