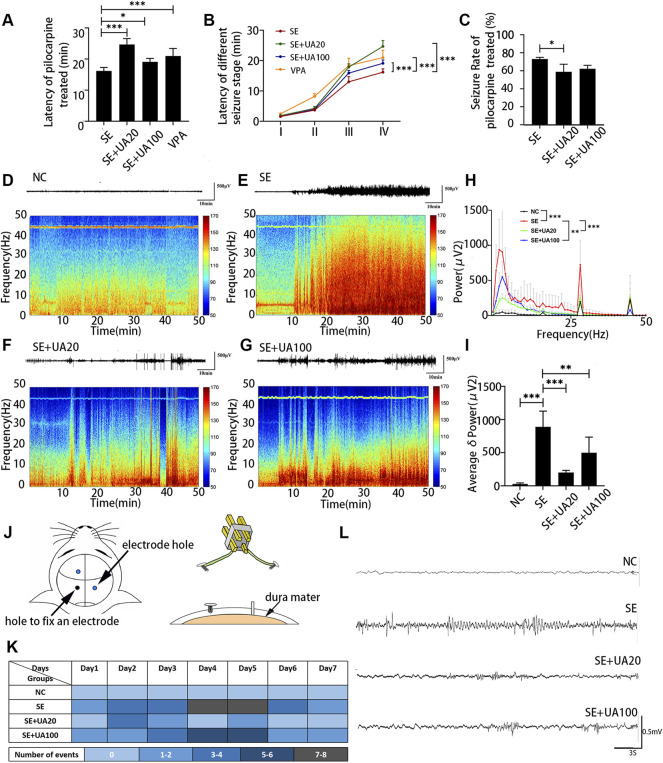
FIGURE 2.
UA reduced the seizure susceptibility and inhibited chronic epilepsy development of the model. (A) The latency of seizure occurrence induced by lithium-pilocarpine. (B) The latency of different seizure stage induced by lithium-pilocarpine. (C) Percentages of rats with developed SE induced by pilocarpine. (D–G) Representative traces of EEG activity and spectrograms of representative EEG recordings for 50 min. Bar: 500 μv, 10 min. (H) FFT analysis of EEG recordings. (I) Comparison of the average δ (0.75–4 Hz) power. (J) Diagram of electrode implantation. (K) Number of “EEG seizure” events in each group. Each individual box was color-coded according to the legend. Each of the numbers in these boxes indicated the total number of events per day. (L) Example of events in each group. Bar: 500 μv, 3 s (n = 6, all values are expressed as means ±SD, ∗∗∗ p < 0.001, ∗∗ p < 0.01, ∗ p < 0.05 vs. SE, one-way ANOVA, or two-way ANOVA).

