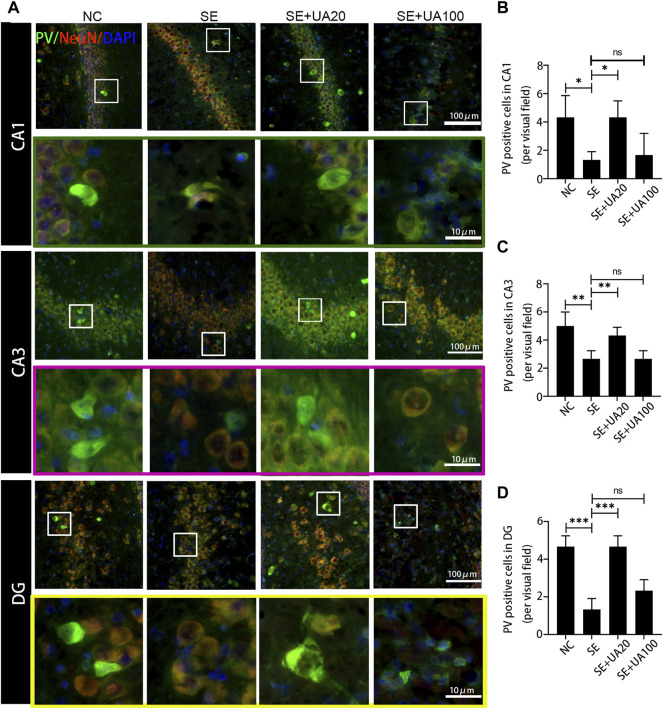
FIGURE 8.
UA promoted the PV expression after SE induction. (A) Immunofluorescent triple-staining of PV (green), NeuN (red), and DAPI (blue) in the CA1, CA3, and DG regions of rat hippocampus. (B–D) The number of PV+ cells in each region of the hippocampus after SE induction. (three rats per group, all values were expressed as means ±SD, ∗∗∗ p < 0.001, ∗∗ p < 0.01, ∗ p < 0.05 vs. SE, one-way ANOVA).

