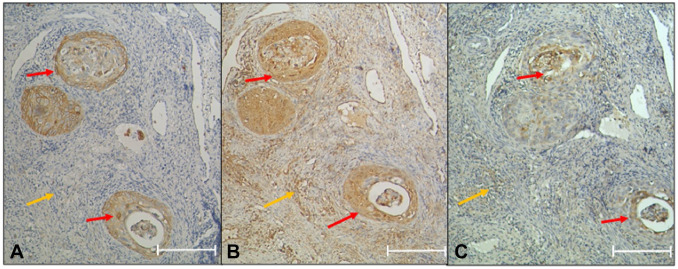
Figure 2.
Invasive squamous cell carcinoma. The GLUT1, LDHA, and MCT4 expression levels are observed in tumor nests (red arrow). (A) GLUT1 negative in stromal cells (yellow arrow). (B) LDHA expression in stromal cells (yellow arrow). (C) MCT4 expression in stromal cells (yellow arrow). Novolink polymer. Scale bar = 200 µm. Abbreviations: GLUT1, glucose transporter I; LDHA, lactate dehydrogenase A; MCT4, monocarboxylate transporter type 4.

