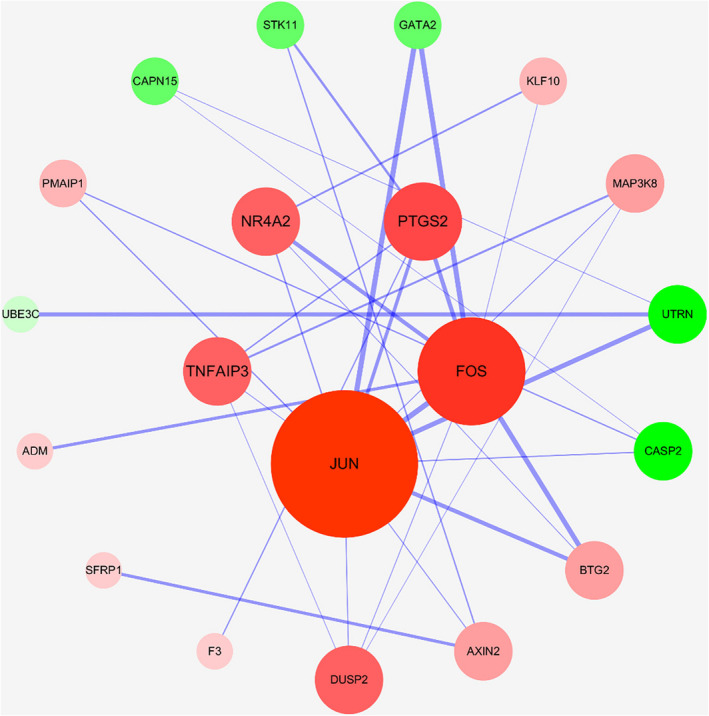
FIGURE 3.

Protein interaction network. Note: Red node represents up‐regulated mRNA, green node represents down‐regulated mRNA, and the line between nodes represents interaction relationship. The larger the node and the darker the color, the greater the degree value. Thickness of the edge reflects the connection score. The thicker the edge, the closer the interaction between mRNAs
