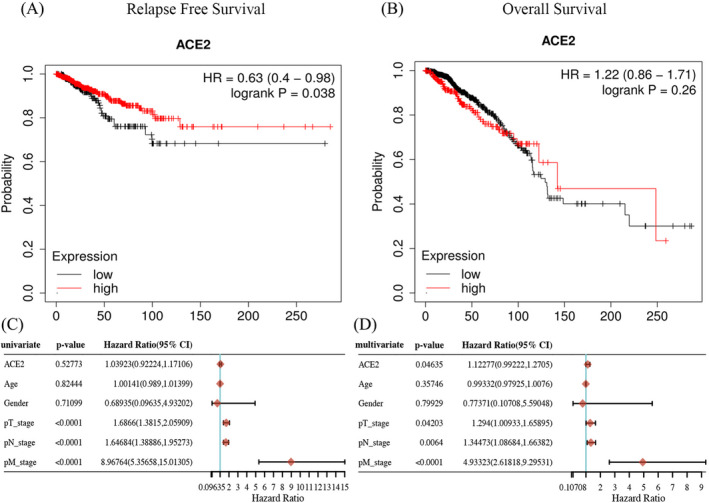
FIGURE 5.

Kaplan‐Meier survival curves obtained by comparing the high and low expression of ACE2 in BRCA in the Kaplan‐Meier plotter database. (A) The relapse‐free survival (RFS) curve with respect to ACE2 expression in BRCA. (B) The overall survival (OS) curve with respect to ACE2 expression in BRCA. (C and D) Univariate and multivariate analysis of ACE2 expression and clinical parameters in BRCA
