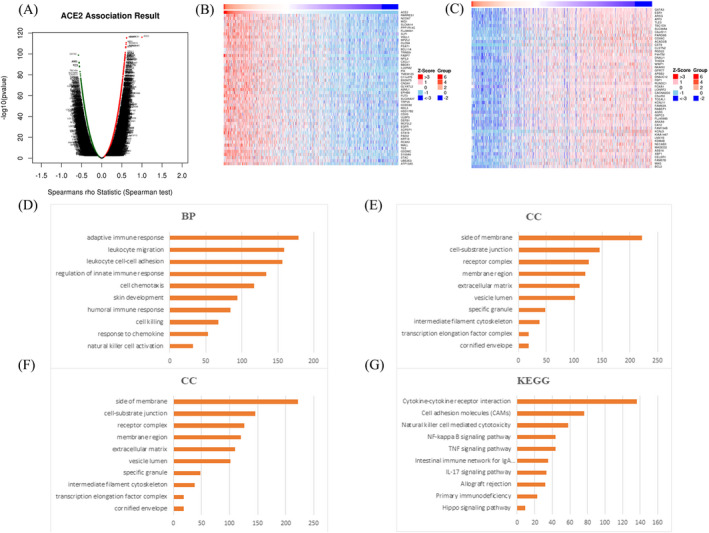
FIGURE 7.

Genes related to ACE2 and enrichment analyses in BRCA (LinkedOmics). (A) Volcano plot showing ACE2 and associated genes’ expression in BRCA by using Spearman test (n = 1093). Dark red dots represent genes positively correlated with ACE2 and dark green dots represent genes negatively correlated with ACE2. (B) Heat map showing top 50 genes positively correlated with ACE2 in BRCA. (C) Heat map showing top 50 genes negatively correlated with ACE2 in BRCA
