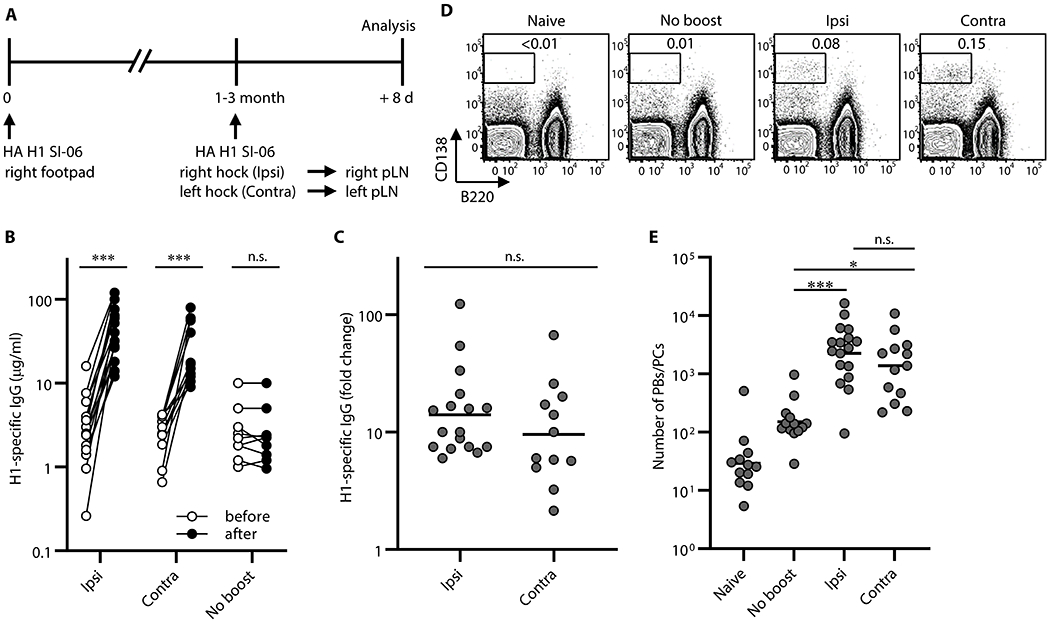
Figure. 1. Boost immunizations at local and distal sites elicit comparable levels of recall serum IgG.

Plasmacytic responses following boosts with homologous antigens. (A) Graphic representation of the immunization strategy used in experiments in Figs. 1–4. (B) Concentrations of serum IgGs specific to H1 SI-06 before and after boosts ipsilaterally (n = 17) or contralaterally (n = 12). No-boost group (n = 9) received primary immunizations but not boosts. Each symbol represents an individual mouse, and serum samples from the same animals are connected with lines. ***, p < 0.001; n.s., p > 0.05 by Wilcoxon matched-pairs signed rank test. (C) Fold changes in concentrations of H1 HA-specific IgGs in serum samples in (B) after boosts. n.s., p > 0.05 by Mann-Whitney’s U test. (D and E) Representative flow diagrams (D) and number (E) of B220loCD138hi PBs/PCs in the draining LNs from naïve (n = 12), No-boost (n = 13), and boosted mice (ipsilateral boost, n = 17; contralateral boost, n = 13). Numbers near boxes in (D) represent frequency of B220loCD138hi cells among live lymphocyte population. ***, p < 0.001; *, p < 0.05; n.s., p > 0.05 by Kruskal-Walis test with Dunn’s multiple comparisons. Combined data from 9 independent experiments are shown.
