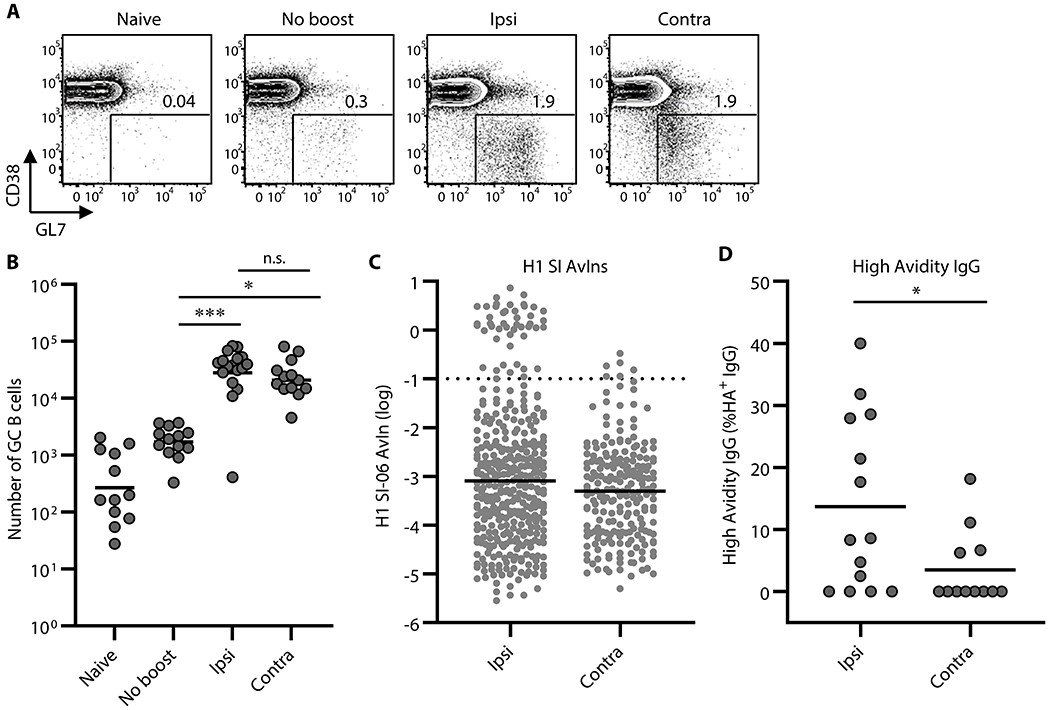
Figure 2. Secondary GCs following local boosts contain a greater proportion of high avidity, antigen-specific B cells than do those following distal boosts.

GC responses following boosts with homologous antigens. (A and B) Representative flow diagrams of GL-7 and CD38 expressions on B220+CD138− cells (A) and number of B220+CD138−GL-7+CD38loIgD− GC B cells in the draining LNs of naïve (n = 12), No-boost (n = 13), and boosted mice (ipsilateral boosts, n = 17; contralateral boosts, n = 13). Numbers near boxes in (A) represent frequency of GL-7+CD38loIgD− cells among B220hiCD138−/lo cells. Horizontal bars in (B) represent geometric mean. ***, p < 0.001; *, p < 0.05; n.s., p > 0.05 by Kruskal-Walis test with Dunn’s multiple comparisons. Combined data from 9 independent experiments are shown. (C) Distributions of avidity index (AvIn) values for H1 HA-specific IgGs from single-cell cultures of GC B cells are shown (n = 368 and 214 for ipsilateral and contralateral boosts, respectively). Each dot represents individual culture supernatant IgG. Horizontal bars represent geometric mean. Dotted line represents AvIn = 0.1, which we considered high avidity. Combined data from 6–8 independent experiments are shown. (D) Frequency of high avidity IgGs (AvIn > 0.1) among HA H1 SI-06 specific IgGs. Each dot represents individual mouse (n = 14, and 12 for ipsilateral and contralateral boosts, respectively). *, p < 0.05 by Mann-Whitney’s U test.
