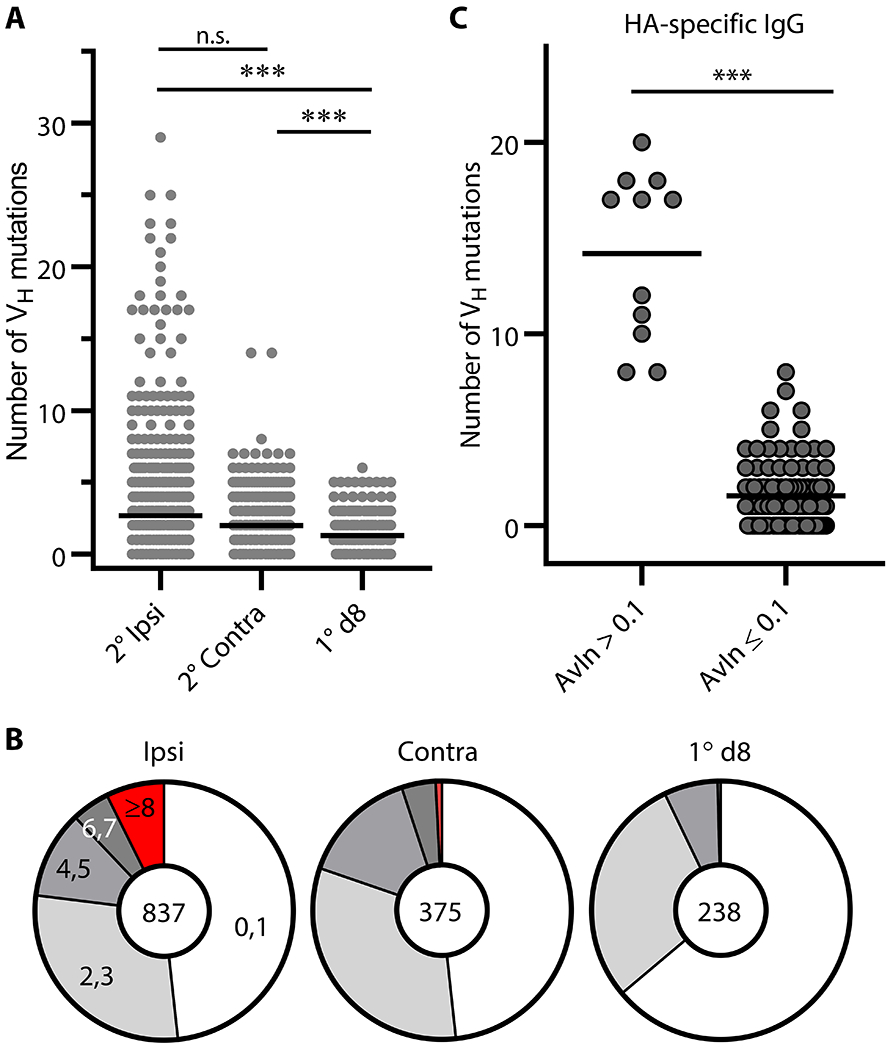
Figure 3. Somatic hypermutation in secondary GC B cells.

(A) Distribution of the number of VH point mutations recovered from secondary (2°) GC B cells following ipsilateral boosts (n = 837) and distal boosts (n = 375). Data for primary (1°) d8 GC B cells (n = 238) are re-plotted from published work of our own (35). Each dot represents an individual IgG+ sample. Horizontal bars represent mean. ***, p < 0.001; n.s., p > 0.05 by Kruskal-Walis test with Dunn’s multiple comparisons. (B) Pie charts depict proportion of IgG examples that carry indicated number of VH point mutations. (C) VH gene sequences for HA H1 SI-06 reactive IgGs were split by their AvIn values into high avidity (AvIn > 0.1; n = 11) and the rest (AvIn ≤ 0.1; n = 102). ***, p < 0.001 by Mann-Whitney’s U test.
