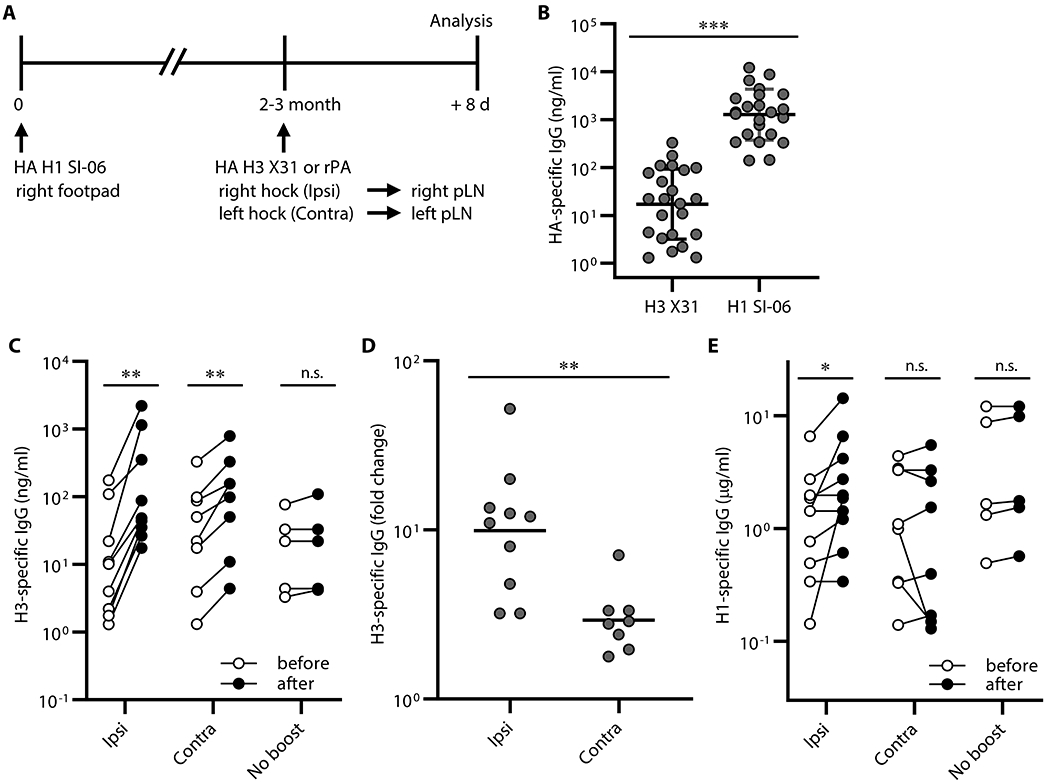
Figure 5. Recall of H1 HA-binding IgG Abs following local boosts with H3 HAs in H1-primed mice.

Serum IgG responses following boosts with heterologous antigens. (A) Graphic representation of the immunization strategy used in experiments described in Figures. 5 and 6. (B) Concentrations of serum IgGs binding to HA H1 SI-06 and HA H3 X31 before boosts (n = 23). ***, p < 0.001 by Mann-Whitney’s U test. (C-D) Mice were randomly selected for ipsilateral (n = 10) or contralateral (n = 8) or no boosts (n = 5). (C) Concentrations of serum IgGs specific to HA H3 X31 before and after boosts ipsilaterally or contralaterally. No-boost group received primary immunizations but not boosts. **, p < 0.01; n.s., p > 0.05 by Wilcoxon matched-pairs signed rank test. (D) Fold changes in concentrations of H3 HA-specific IgGs in serum samples in (C) after boosts. **, p < 0.01; by Mann-Whitney’s U test. (E) Concentrations of serum IgGs specific to HA H1 SI-06 in serum samples in (C). Each symbol represents an individual mouse (B-E), and serum samples from the same animals are connected with lines (C and E). *, p < 0.05; n.s., p > 0.05 by Wilcoxon matched-pairs signed rank test. Combined data from 4 independent experiments are shown.
