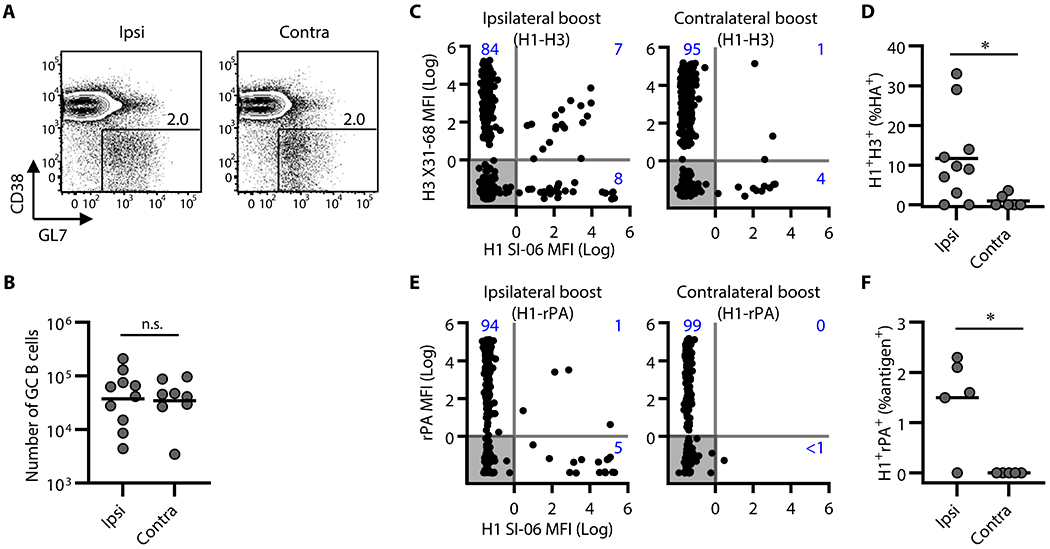
Figure 6. Participation of H1/H3 cross-reactive B cells in secondary GCs following local boosts with H3 HAs in H1 HA-primed mice.

GC responses following boosts with heterologous antigens. (A and B) Representative flow diagrams of GL-7 and CD38 expression on B220+CD138− cells (A) and number of B220+CD138−GL-7+CD38loIgD− GC B cells in the draining LNs of boosted mice (ipsilateral boosts, n = 10; contralateral boosts, n = 8). Numbers near boxes in (A) represent frequency of GL-7+CD38loIgD− cells among B220hiCD138−/lo cells. Horizontal bars in (B) represent geometric mean. n.s., p > 0.05 by two-tailed Student’s t test. Combined data from 4 independent experiments are shown. (C-F) Individual GC B cells were placed in Nojima cultures for determination of BCR reactivity. H3 X31 ipsilateral boosts (n = 1,825), H3 X31 contralateral boosts (n = 1,696), rPA ipsilateral boosts (n = 1,130), and rPA contralateral boosts (n = 1,082). (C and E) Background-subtracted, normalized MFI values (Log10) for H1 SI-06 (x-axes) and H3 X31 (C, y-axes) or rPA (E, y-axes). Numbers in each quadrant represent frequencies of H1 or H3 or H1/H3 (C) reactive IgGs and H1 or rPA or H1/rPA reactive IgGs among antigen-specific clonal IgGs. Each dot represents an individual clonal IgG. (D and F) Frequencies of H1/H3 cross-reactive IgGs (D) and of H1/rPA cross-reactive IgGs (F) among all antigen-specific IgG. Each dot represents an individual mouse. *, p < 0.05 by Mann-Whitney’s U test. Combined data from 2 (rPA boosts) and 4 (H3 X31 boosts) independent experiments are shown.
