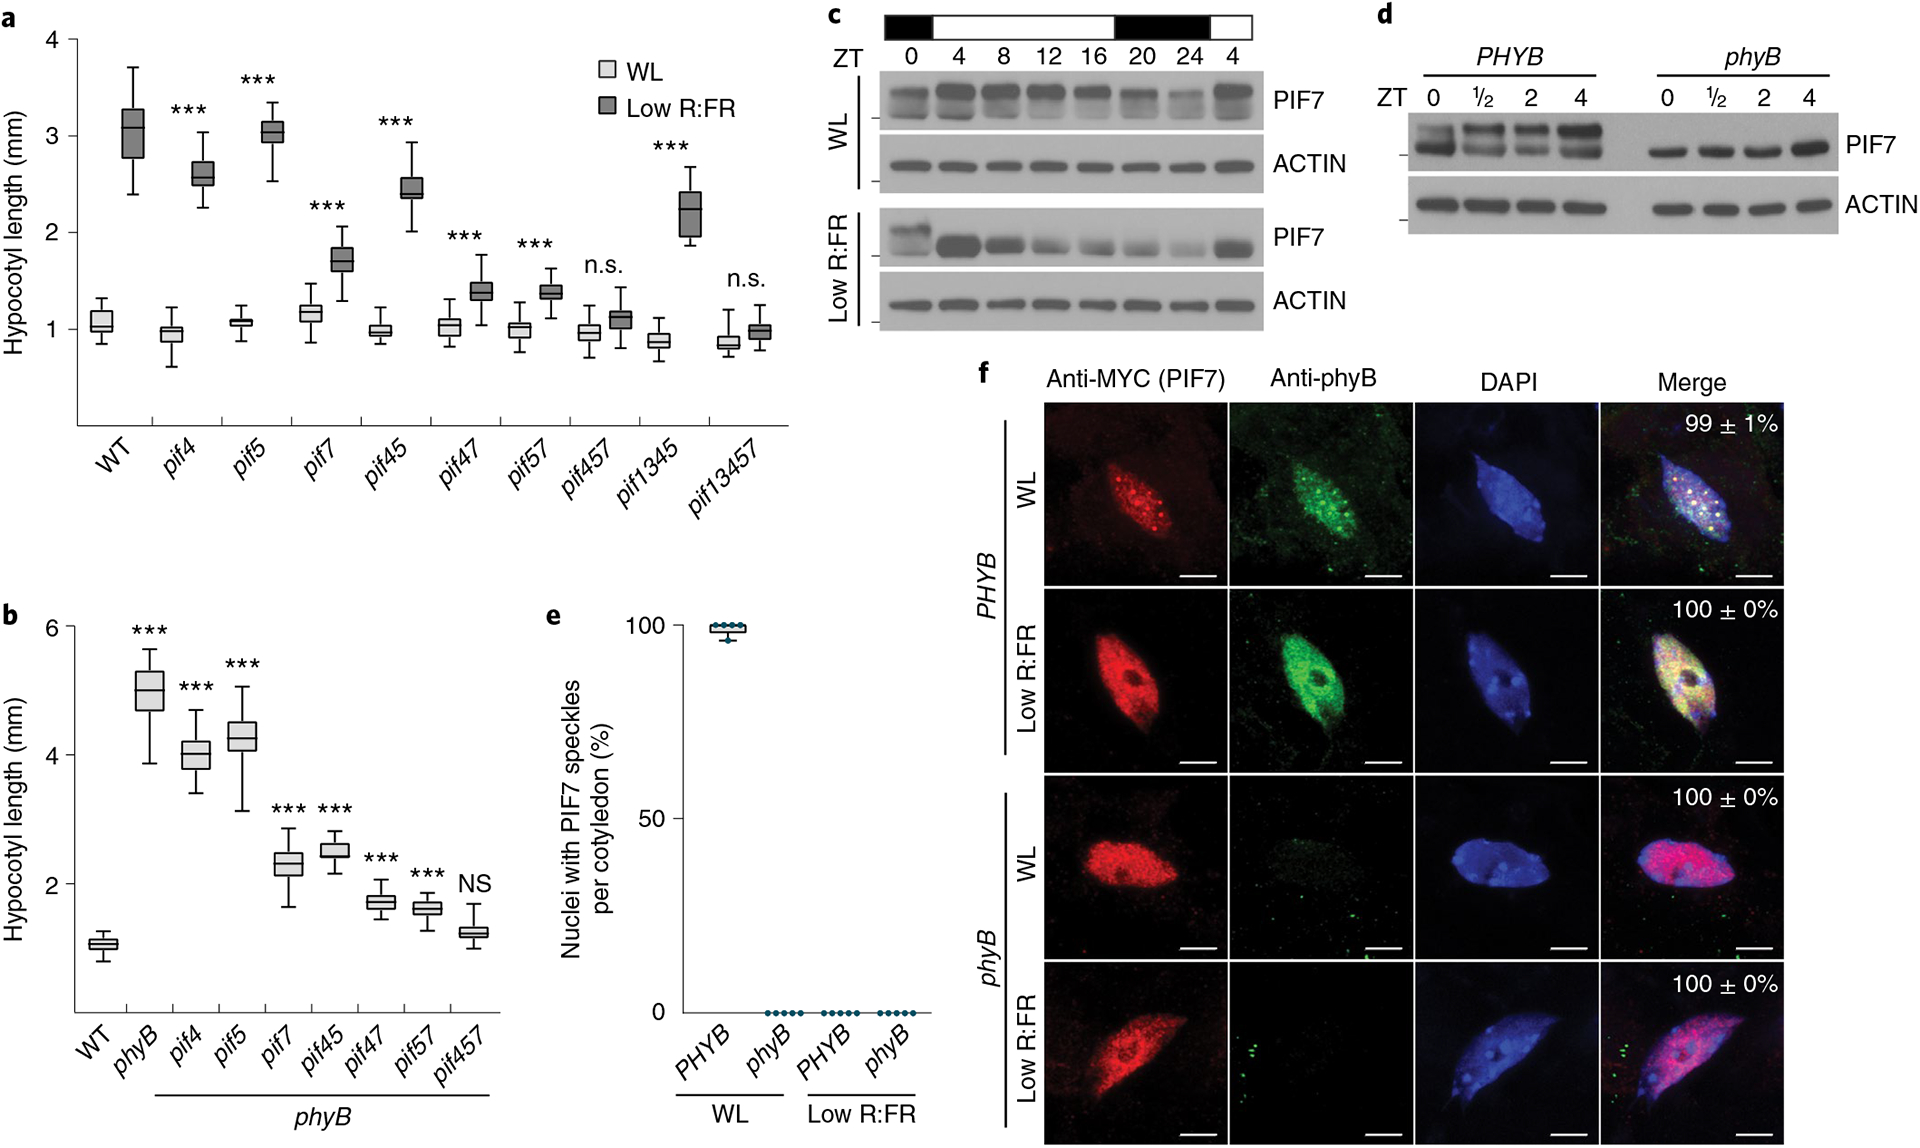
Fig. 1 |. Role of PIF7 and phyB in low R:FR–induced hypocotyl growth.

a,b, Hypocotyl length measurements. WT (n = 23/20, P < 0.001), pif4 (n = 27/22, P < 0.001), pif5 (n = 22/24, P < 0.001), pif7 (n = 23/24, P < 0.001), pif45 (n = 27/26, P < 0.001), pif47 (n = 26/28, P < 0.001), pif57 (n = 25/25, P < 0.001), pif457 (n = 25/24, P = 0.275), pif1345 (n = 21/16, P < 0.001) and pif13457 (n = 23/22, P = 0.494) seedlings grown in WL or in response to low R:FR (a) and WT (n = 22), phyB (n = 22, P < 0.001), phyB pif4 (n = 21, P < 0.001), phyB pif5 (n = 26, P < 0.001), phyB pif7 (n = 22, P < 0.001), phyB pif45 (n = 20, P < 0.001), phyB pif47 (n = 22, P < 0.001), phyB pif57 (n = 26, P < 0.001) and phyB pif457 (n = 27, P = 0.218) seedlings grown in WL (b). Stars denote statistically significant differences between light conditions (a) or between WT and mutants (b) (two-way analysis of variance (ANOVA) (a) or one-way ANOVA (b), Tukey’s multiple comparisons test, n.s. (not significant) P > 0.05, *P ≤ 0.05, **P ≤ 0.01, ***P ≤ 0.001). c, Immunoblot of pif457 PIF7:PIF7:4xMYC in LD. Six-day-old seedlings continued to grow in WL or where exposed to low R:FR at ZT0. Marks next to cropped blots represent 50 kDa (PIF7:4xMyC) or 37 kDa (ACTIN), respectively. d, Immunoblot analysis of pif457 PIF7:PIF7:4xMYC and phyB pif457 PIF7:PIF7:4xMYC seedlings (6-day-old, LD, WL). Marks next to cropped blots represent 50 kDa (PIF7:4xMyC) or 37 kDa (ACTIN), respectively. e, Quantification of percentages of nuclei with PIF7:4xMyc nuclear bodies as shown in f. Five seedlings from each condition with at least 15 randomly selected nuclei per seedling were examined. f, Subnuclear localization patterns of PIF7:4xMyc and phyB in cotyledon epidermal nuclei of 6-day-old pif457 PIF7:PIF7:4xMYC and phyB pif457 PIF7:PIF7:4xMYC seedlings grown in LD. Seedlings were fixed at ZT4 (WL) or after a subsequent 30 min low R:FR treatment. PIF7:4xMyC (red) and phyB (green) were labeled by immunolocalization using anti-MyC and anti-phyB antibodies, respectively. Nuclei were stained with DAPI (blue). The percentage of nuclei with the indicated pattern, including s.e.m., is shown in merged images; n indicates the number of nuclei analyzed. Scale bar, 5 μm. In a, b and e, boxes extend from the 25th to 75th percentiles. Middle lines represent medians. Whiskers extend to the smallest and largest values, respectively.
