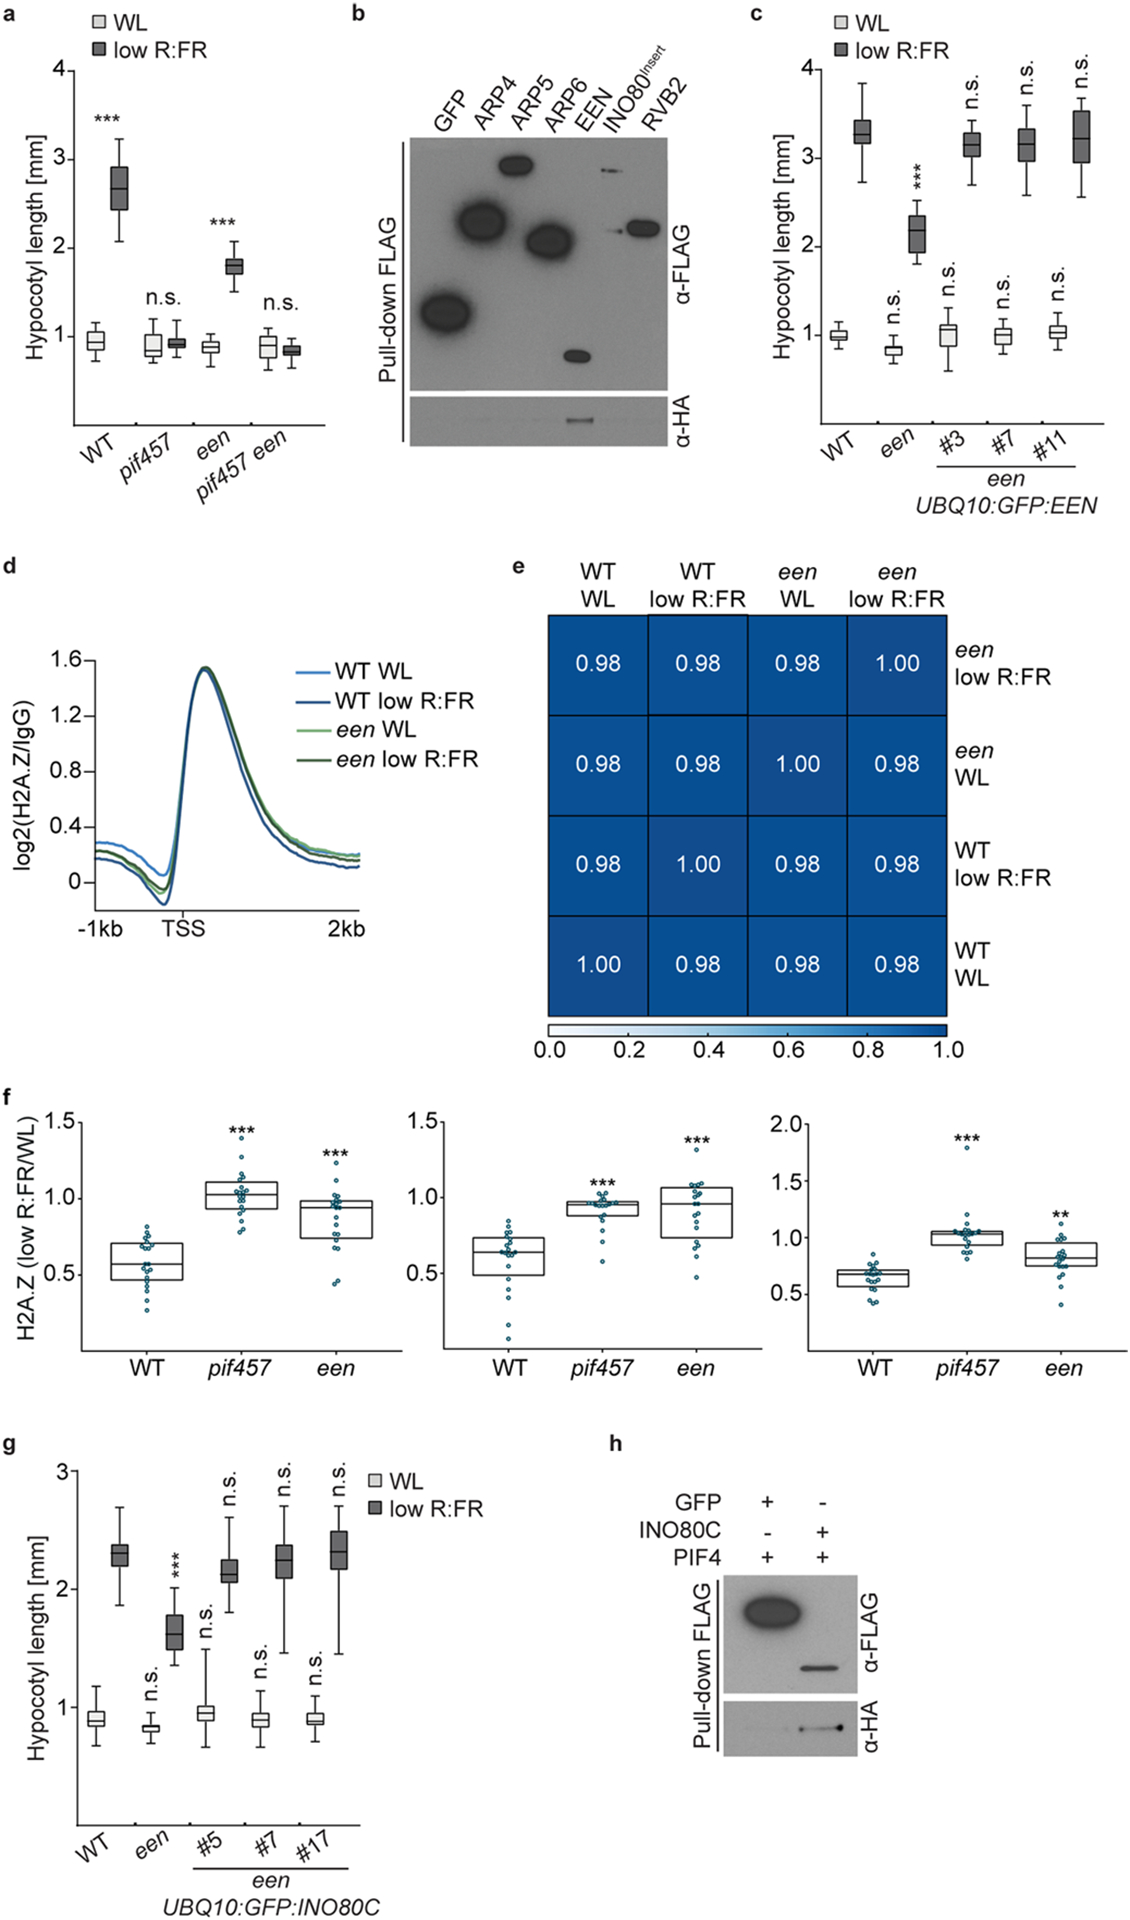
Extended Data Fig. 5 |. PIF-EEN/INO80C interaction and een mutant complementation.

a, Hypocotyl length of WT (n = 15/17, P < 0.001), pif457 (n = 17/13, P = 0.996), een (n=14/14, P < 0.001) and pif457 een (n = 12/15, P = 0.994) seedlings grown in WL or in response to low R:FR. b, Pull-down assay with in vitro translated proteins. ARP4, ARP5, ARP6, EEN, INO80 insertion domain (INO80Insert)64, and RVB2 were tagged with FLAG and PIF4 with HA. FLAG:GFP served as negative control. c, Hypocotyl length of WT (n = 16/18), een (n = 19/18, P = 0.406/P < 0.001) and een UBQ10:GFP:EEN line #3 (n = 15/17, P > 0.999/P = 0.49), #7 (n = 15/17, P > 0.999/P = 0.319) and #11 (n = 16/17, P > 0.999/P = 0.977). d, Aggregated H2A.Z profiles of all Arabidopsis genes (TAIR10) in WL and low R:FR-treated WT and een seedlings show H2A.Z occupancy around the TSS. e, Spearman’s correlation plot shows the correlation of read coverages between WL and low R:FR-treated WT and een H2A.Z ChIP-seq samples. Clustering was determined by the degree of correlation. f, Box plots show level of H2A.Z loss at the 20 most dynamic genes in WT, pif457 and een seedlings at ZT4 for three independent experiments. Boxes extend from the 25th to 75th percentiles. Middle lines represent the median. Stars denote statistically significant differences in comparison to WT (one-way ANOVA, Tukey’s multiple comparisons test, n.s. P > 0.05, * P ≤ 0.05, ** P ≤ 0.01, *** P ≤ 0.001). g, Hypocotyl length measurements of WT (n = 37/35), een (n = 30/31, P = 0.806/P < 0.001) and een UBQ10:GFP:INO80C line #5 (n = 40/38, P = 0.877/P = 0.145), #7 (n = 37/37, P > 0.999/ P > 0.999) and #17 (n = 38/37, P > 0.999/ P > 0.999). h, Pull-down assay with in vitro translated proteins. INO80C was tagged with FLAG and PIF4 with HA. FLAG:GFP served as a negative control. In a, c and g, boxes extend from the 25th to 75th percentiles. Middle lines represent medians. Whiskers extend to the smallest and largest values, respectively. Stars denote statistically significant differences between light conditions (a) or versus WT for the respective light condition (c and g) (two-way ANOVA, Tukey’s multiple comparisons test, n.s. P > 0.05, * P ≤ 0.05, ** P ≤ 0.01, *** P ≤ 0.001).
