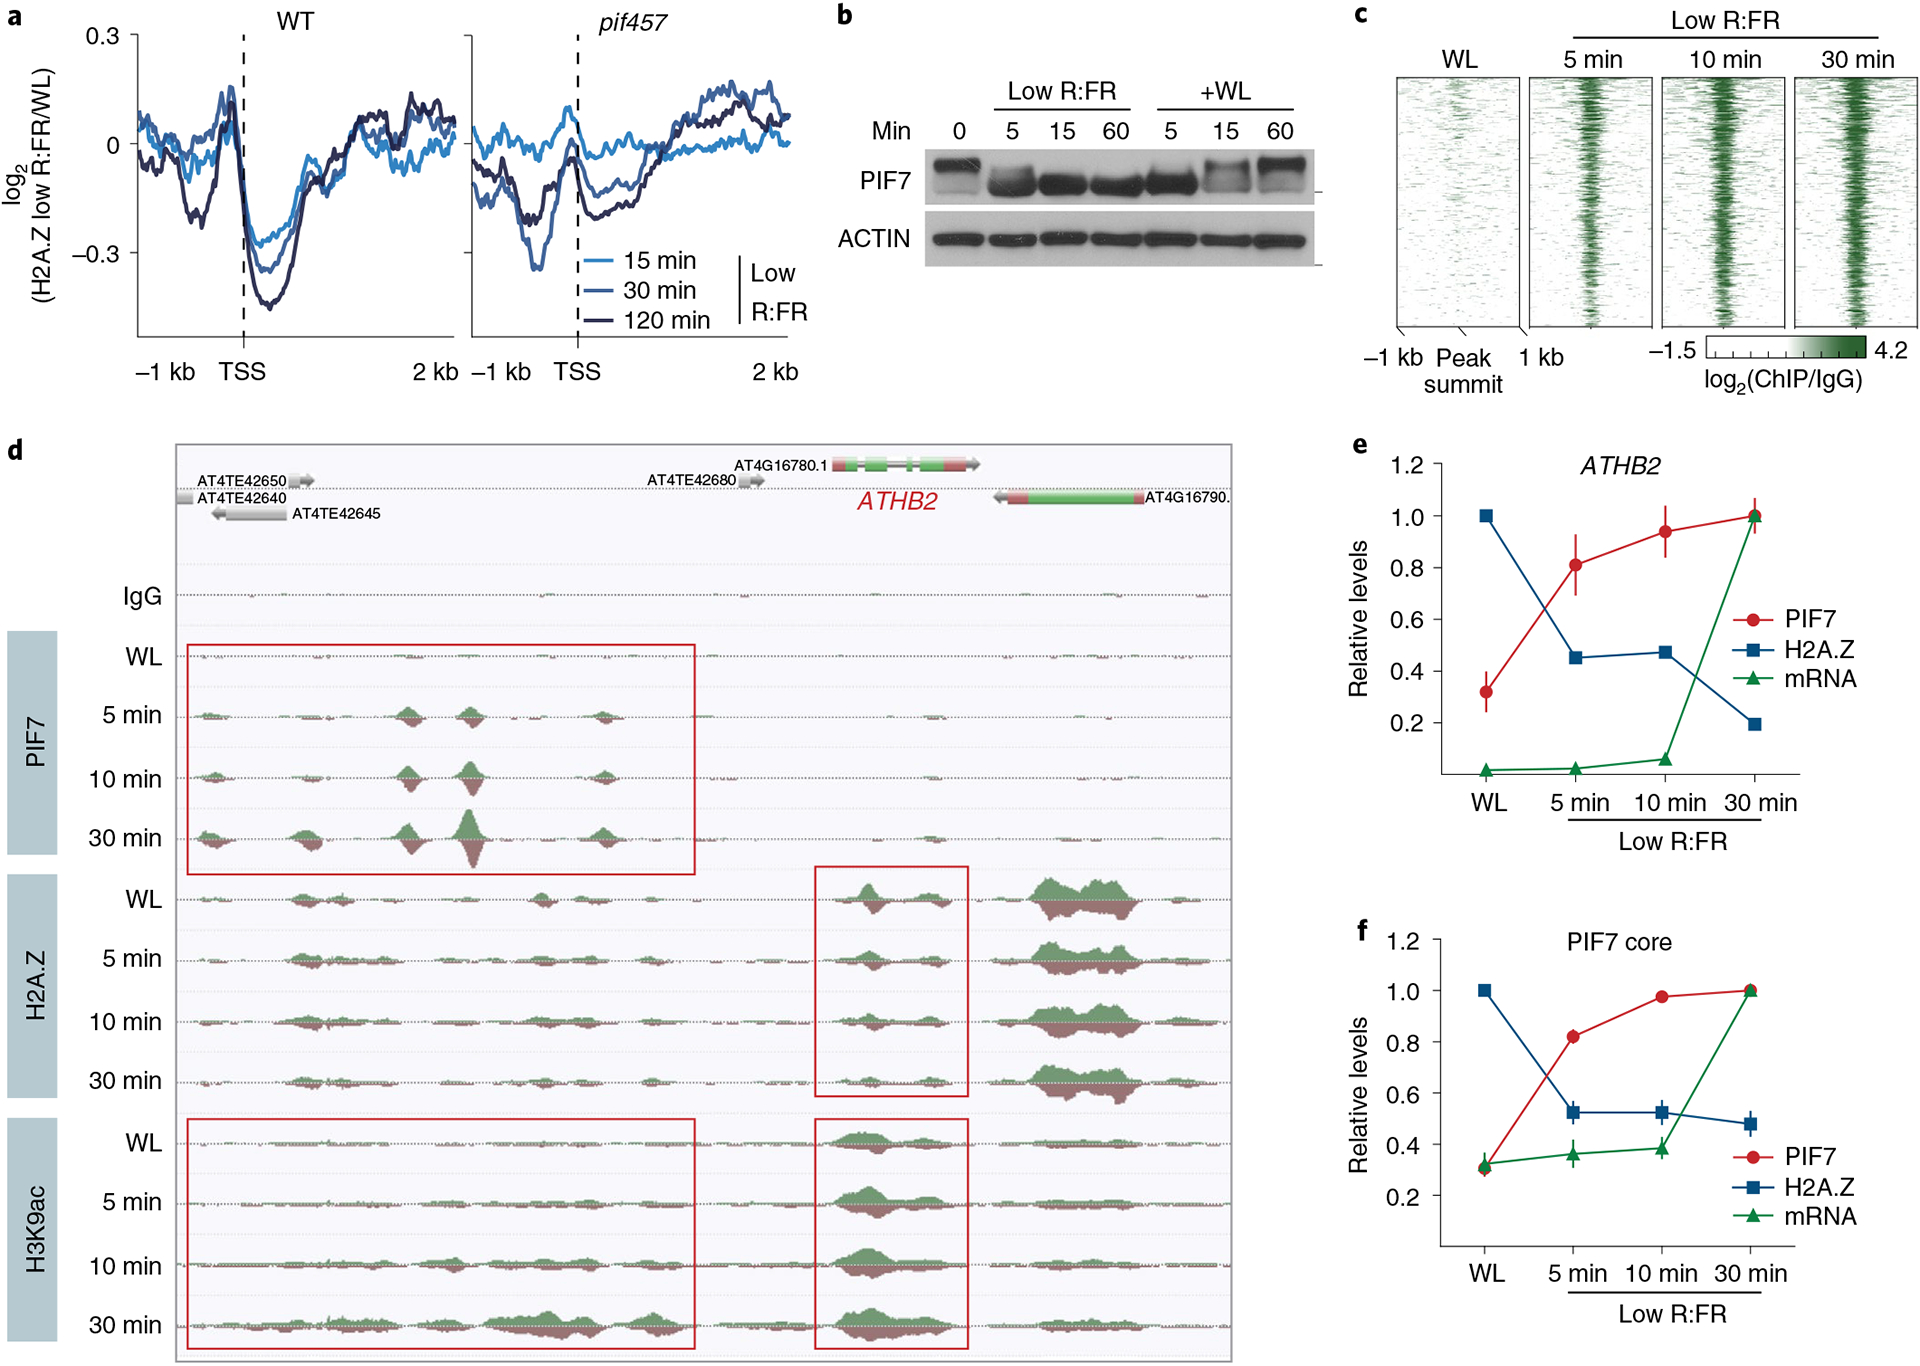
Fig. 4 |. DNA binding of PIF7 initiates low R:FR–induced H2A.Z removal at its target genes.

a, Aggregated profiles display low R:FR–induced H2A.Z depletion in WT and pif457 seedlings. Loss of H2A.Z is visualized as the log2 (fold change) between WL and low R:FR–exposed H2A.Z ChIP–seq samples around the TSS of 200 genes that show strong H2A.Z loss in WT after 2 hours of low R:FR light exposure. b, Immunoblot of pif457 PIF7:PIF7:4xMYC grown in constant WL. Six-day-old seedlings were exposed to low R:FR and subsequently moved back to WL for the indicated time points. Marks next to cropped blots represent 50 kDa (PIF7:4xMyC) or 37 kDa (ACTIN), respectively. c, Heat map visualizing the low R:FR–induced DNA binding (log2 (fold change)) of PIF7 at the top 500 binding sites (strongest binding after 30 min of low R:FR exposure) in pif457 PIF7:PIF7:4xMYC seedlings at the indicated time points. d, AnnoJ genome browser screenshot visualizing PIF7 binding, H2A.Z occupancy and H3K9 acetylation at the ATHB2 gene over time, which was determined in the same chromatin (pif457 PIF7:PIF7:4xMYC) by ChIP–seq. The areas marked in red indicate the PIF7-bound regulatory region and gene body region of ATHB2. e,f, Quantification of relative PIF7 binding (red) and H2A.Z levels (blue) at ATHB2 (e) and the PIF7 core gene set (f). PIF7 binding in peak summit regions (ratio between two PIF7 ChIP–seq replicates and control) at 30 min of low R:FR exposure was set to 1 for each target gene. H2A.Z occupancy (ratio between H2A.Z ChIP–seq sample and control) at WL exposure was set to 1. mRNA expression measured in TPM (transcripts per kilobase million) at 30 min of low R:FR exposure was set to 1 for each gene. The mean ± s.e.m. in e represents levels of PIF7 (n = 2), H2A.Z (n = 2) and ATHB2 mRNA (n = 3). The mean ± s.e.m. in f represents levels of PIF7 binding, H2A.Z occupancy and mRNA expression of the PIF7 core genes (n = 20 genes examined over two independent experiments).
