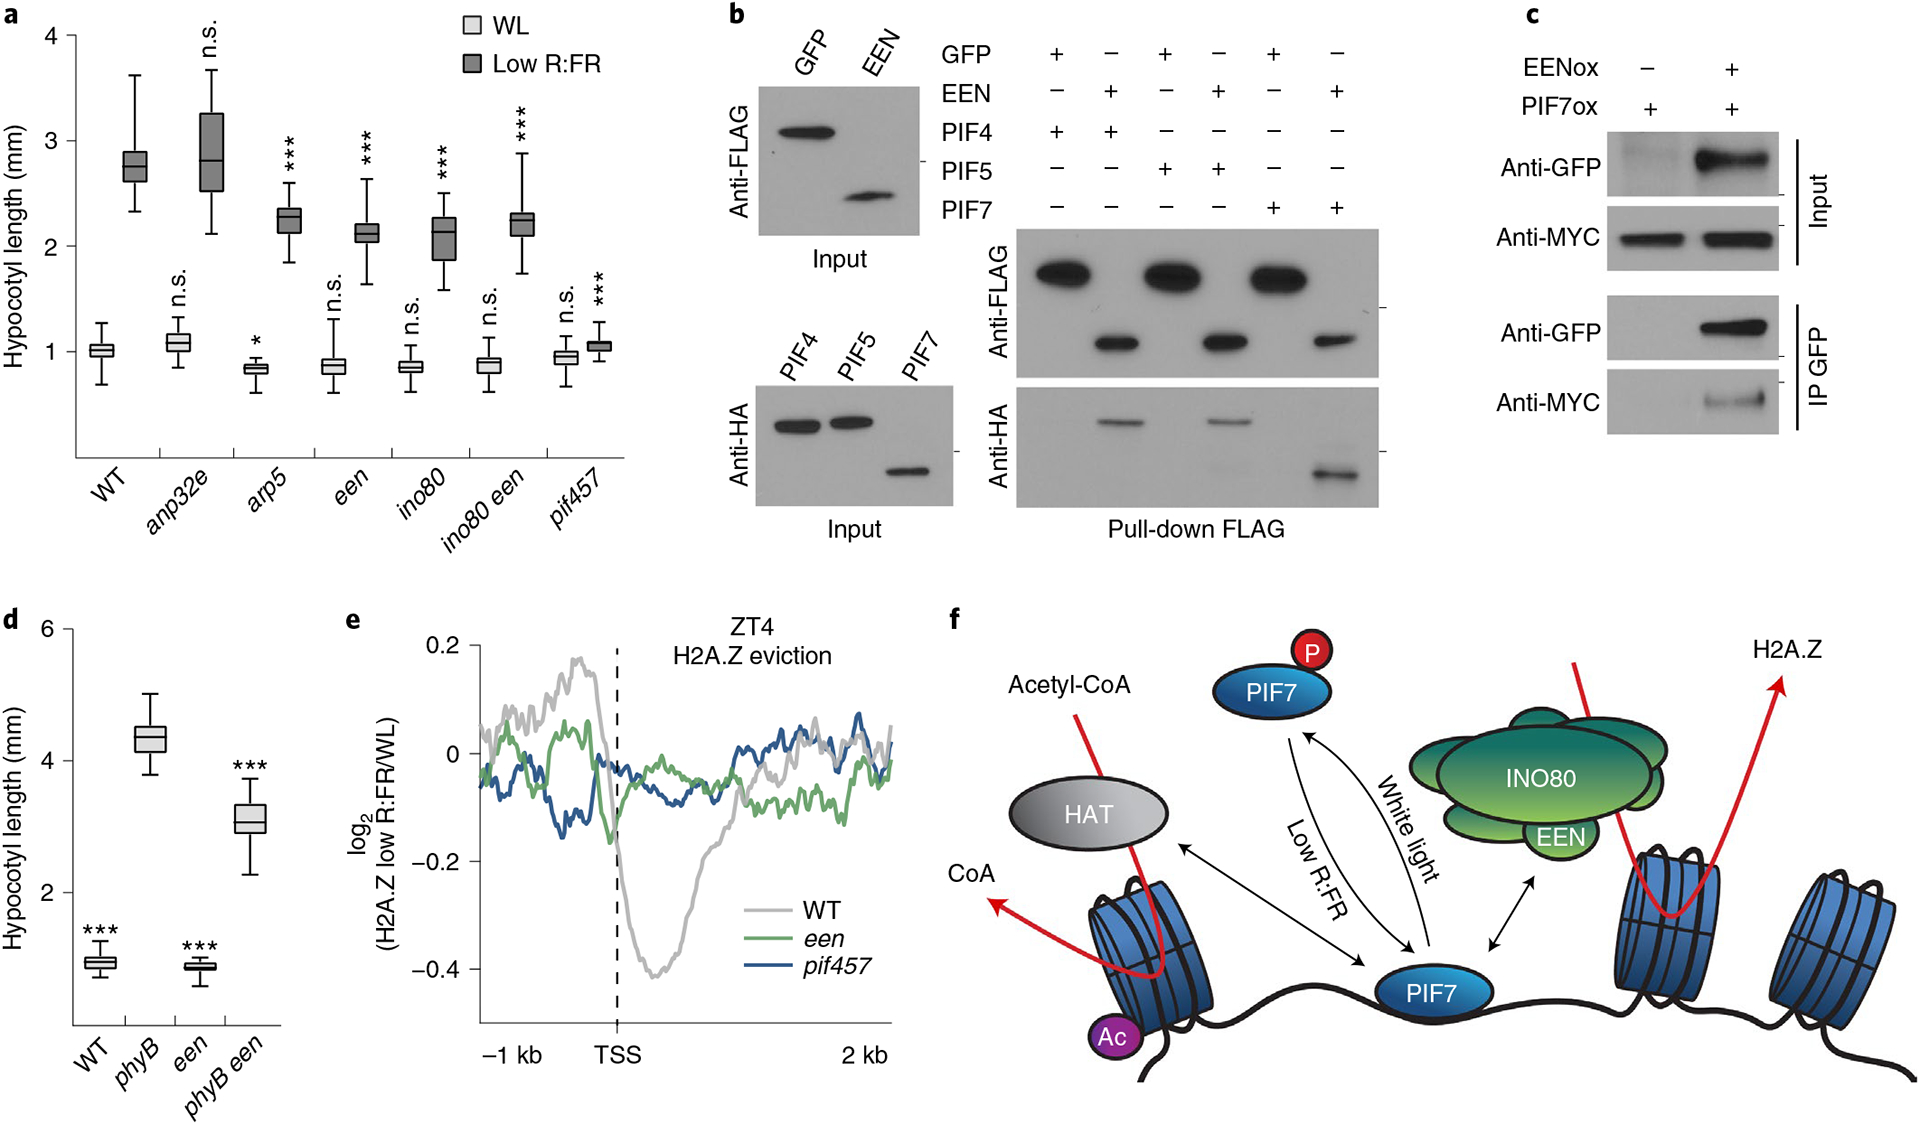
Fig. 5 |. A PIF7–INO80 regulatory module facilitates low R:FR–induced H2A.Z removal.

a, Hypocotyl length measurements of WT (n = 24/20), anp32e (n = 31/22, P = 0.991/P > 0.999), arp5 (n = 31/28, P = 0.044/P < 0.001), een (n = 26/26, P = 0.478/P < 0.001), ino80 (n = 27/19, P = 0.251/P < 0.001), ino80 een (n = 27/20, P = 0.495/P < 0.001) and pif457 (n = 22/30, P = 0.996/P < 0.001) seedlings grown in WL or in response to low R:FR. Stars denote statistically significant differences between WT and mutants grown in WL or in low R:FR, respectively (two-way ANOVA, Tukey’s multiple comparisons test, n.s. P > 0.05, *P ≤ 0.05, **P ≤ 0.01, ***P ≤ 0.001. b, Pull-down assay using in vitro-translated FLAG:EEN and HA:PIF proteins. FLAG:GFP served as negative control. Marks next to cropped blots represent 25 kDa (anti-FLAG) or 50 kDa (anti-HA), respectively. c, Co-immunoprecipitation (IP) using 6-day-old seedlings overexpressing MyC-tagged PIF7 alone or in combination with GFP-tagged EEN. Marks next to cropped blots represent 37 kDa (anti-GFP) or 75 kDa (anti-MyC), respectively. d, Hypocotyl length measurements of WT (n = 22, P < 0.001), phyB (n = 16), een (n = 24, P < 0.001) and phyB een (n = 24, P < 0.001) grown in WL. Stars denote statistically significant differences between phyB and the other genotypes (one-way ANOVA, Tukey’s multiple comparisons test, n.s. P > 0.05, *P ≤ 0.05, **P ≤ 0.01, ***P ≤ 0.001). e, Aggregated profiles display low R:FR–induced H2A.Z loss in WT, een and pif457 seedlings at ZT4. Loss of H2A.Z (log2 (fold change) between WL and low R:FR–exposed H2A.Z ChIP–seq samples) is visualized around the TSS of 464 genes that show H2A.Z depletion (≥1.25-fold) after low R:FR exposure in WT seedlings. f, Model for the control of low R:FR–induced H2A.Z removal through the PIF7–INO80 regulatory module. Upon exposure to low R:FR light, PIF7 is dephosphorylated and subsequently binds to its target sites where it potentially interacts with the EEN subunit of the INO80 complex and an unknown histone acetyltransferase (HAT). Consequently, gene-body-localized H2A.Z is removed, H3K9 in regulatory regions is acetylated (Ac) and gene expression of PIF7 target genes will be initiated. In a and d, boxes extend from the 25th to 75th percentiles. Middle lines represent medians. Whiskers extend to the smallest and largest values, respectively.
