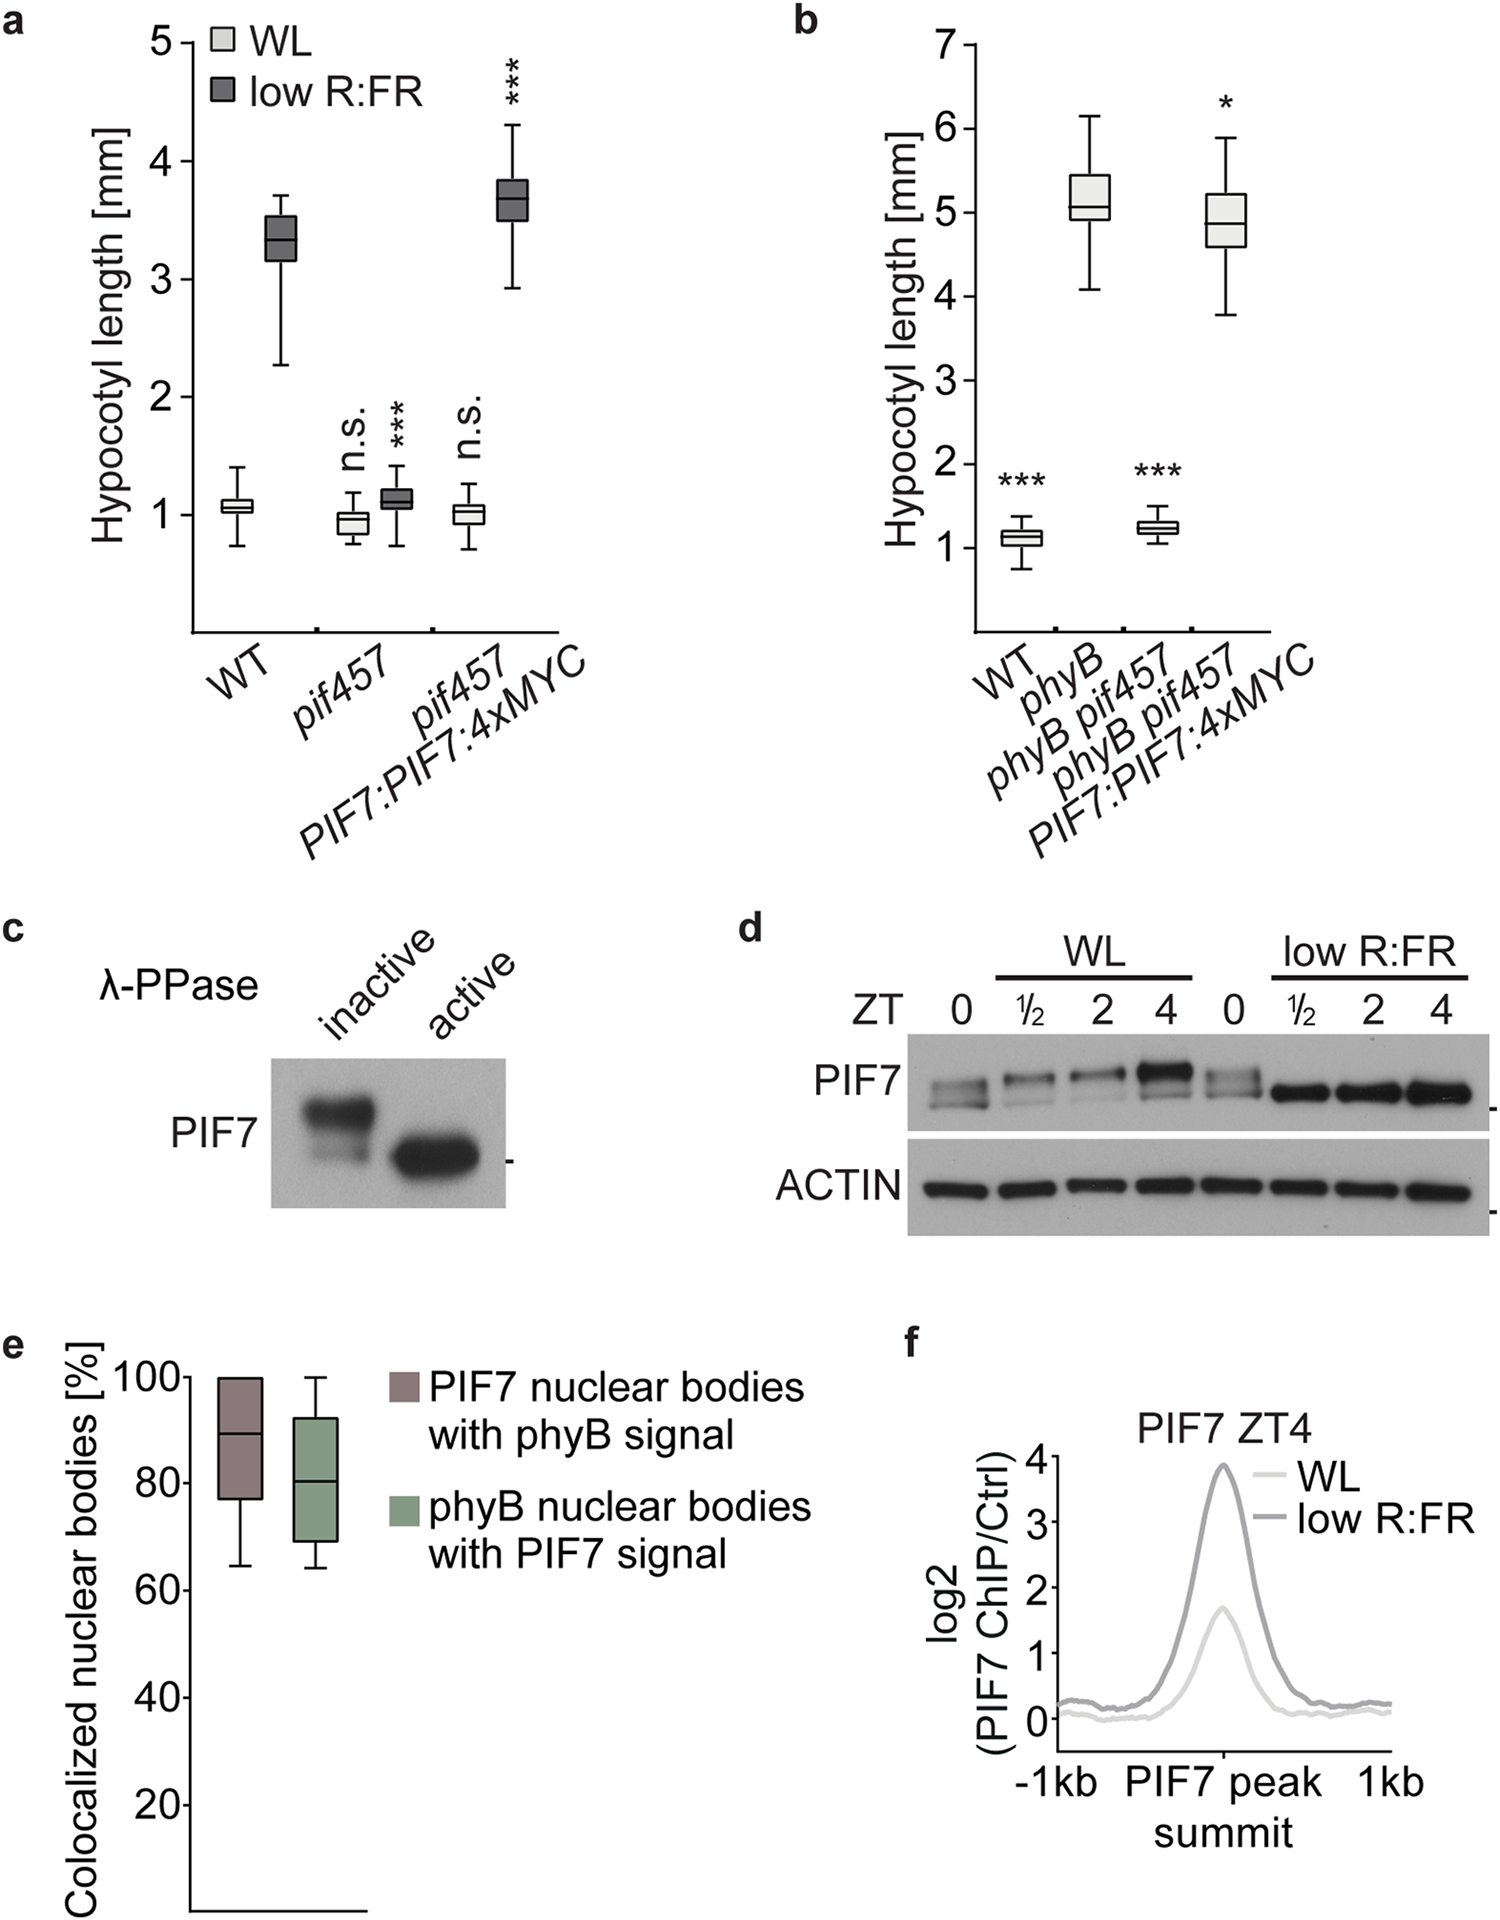
Extended Data Fig. 1 |. PIF7 activity is regulated by low R:FR light exposure.

a, Hypocotyl length measurements of WT (n = 30/30), pif457 (n = 30/32, P = 0.271/P < 0.001) and pif457 expressing PIF7:PIF7:4xMYC (n = 36/36, P = 0.823/P < 0.001) in white light or in responses to low R:FR. Stars denote statistically significant differences between WT and the other genotypes for the respective light condition (two-way ANOVA, Tukey’s multiple comparisons test, n.s. P > 0.05, * P ≤ 0.05, ** P ≤ 0.01, *** P ≤ 0.001). b, Hypocotyl length measurements of WT (n = 26, P < 0.001), phyB (n = 33), phyB pif457 (n = 23, P < 0.001) and phyB pif457 expressing PIF7:PIF7:4xMYC (n = 34, P = 0,027) grown in WL. Stars denote statistically significant differences between phyB and the other genotypes (one-way ANOVA, Tukey’s multiple comparisons test, n.s. P > 0.05, * P ≤ 0.05, ** P ≤ 0.01, *** P ≤ 0.001). c, Immunoblot with anti-MyC of immunoprecipitated PIF7:4xMyC that had been treated with boiled (inactive) or native (active) λ-phosphatase (λ-PPase). PIF7:4xMyC was immunoprecipitated from 6 days old seedlings, grown in WL and harvested at ZT4. Mark next to cropped blot represent 50 kDa. d, Immunoblot analysis of pif457 PIF7:PIF7:4xMYC in LD. 6-day-old seedlings continued to grow in WL or where exposed to low R:FR at ZT0. Marks next to cropped blots represent 50 kDa (PIF7:4xMyC) or 37 kDa (ACTIN), respectively. e, Colocalization of PIF7:4xMyC and phyB containing nuclear speckles per nucleus. The number of phyB nuclear bodies (n = 105), PIF7 nuclear bodies (n = 98), and co-localized PHyB/PIF7 nuclear bodies were scored and used to calculate the percentage of co-localization of PHyB and PIF7. f, Aggregated profile shows the low R:FR dependent difference between PIF7 binding at ZT4. PIF7 binding was determined in WL and low R:FR-exposed pif457 PIF7:PIF7:4xMYC seedlings by ChIP-seq. PIF7 occupancy is shown from 1 kb upstream to 1 kb downstream of the 500 strongest PIF7 binding events. In a, b and e, boxes extend from the 25th to 75th percentiles. Middle lines represent medians. Whiskers extend to the smallest and largest values, respectively.
