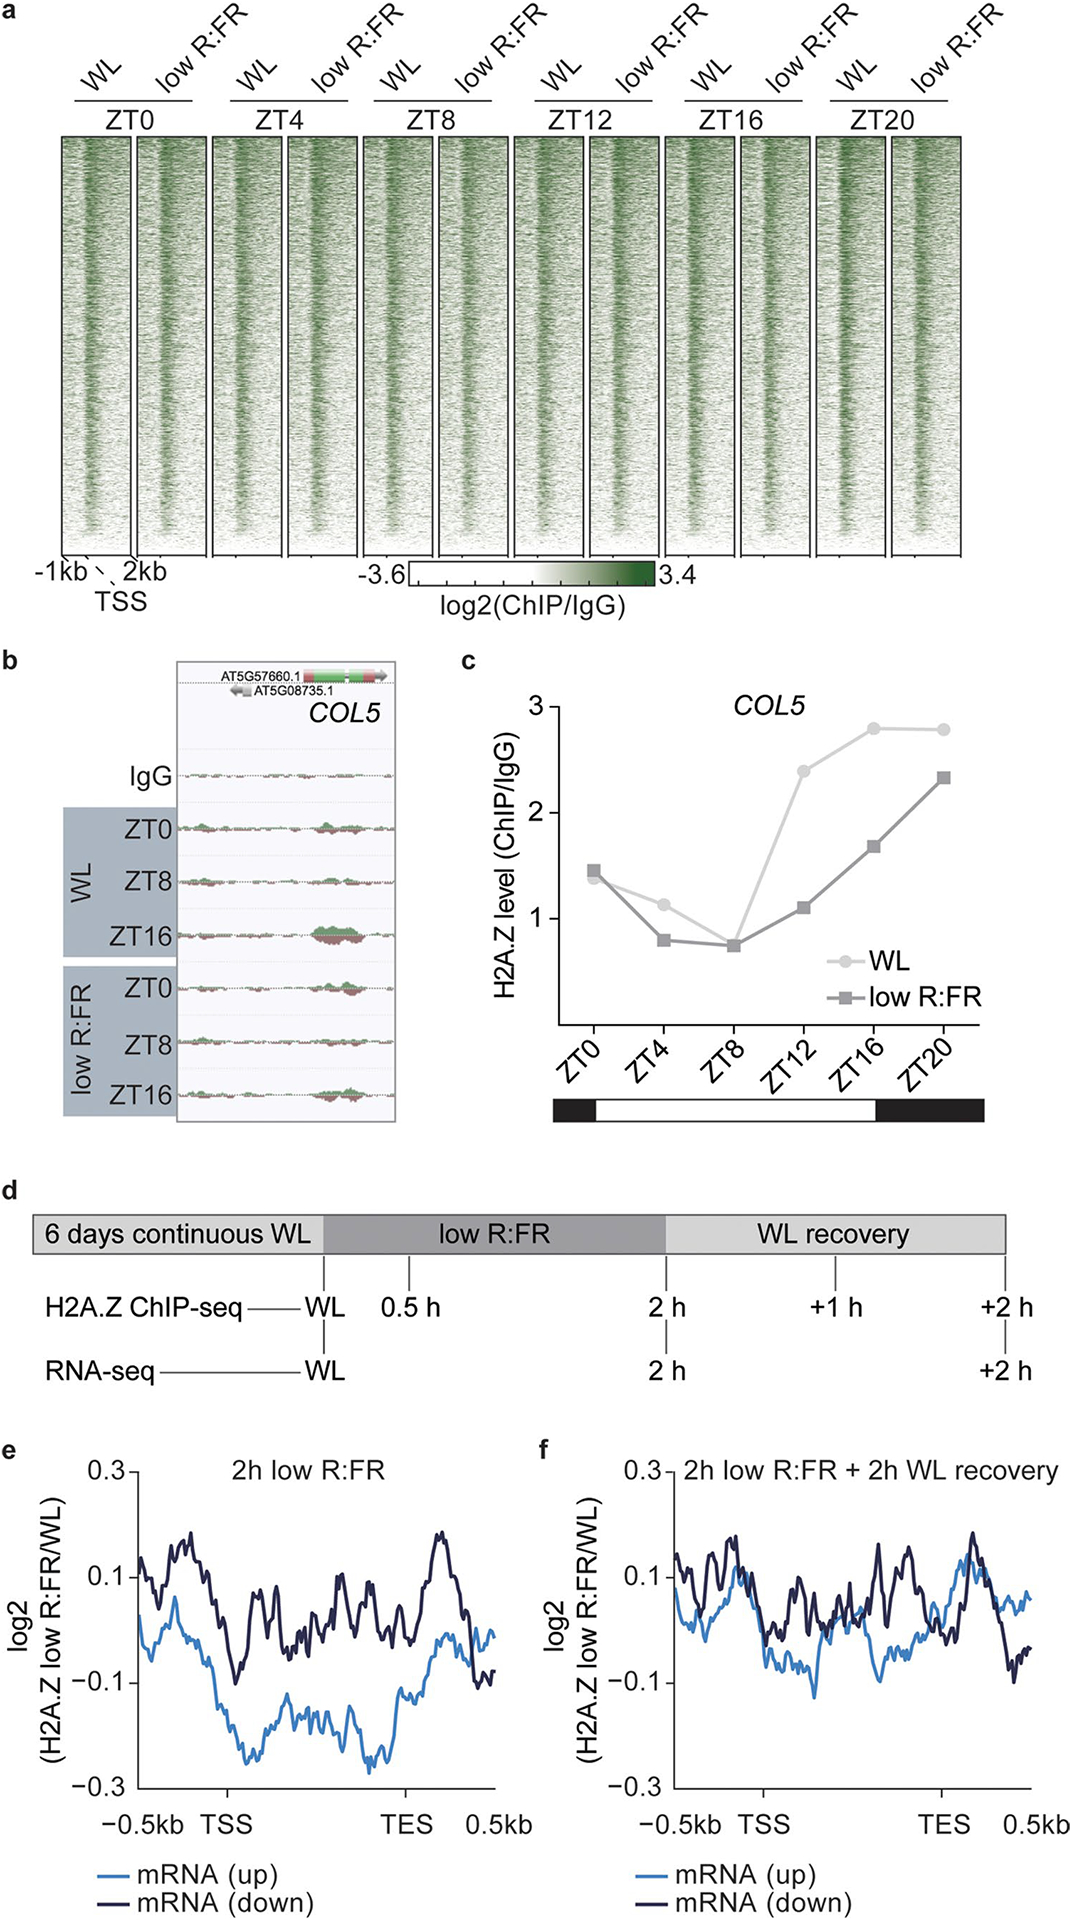
Extended Data Fig. 2 |. Low R:FR light manipulates H2A.Z dynamics.

a, Heatmap visualizes absolute H2A.Z of all Arabidopsis thaliana protein-coding genes (TAIR10) at the indicated time points and light treatments. H2A.Z occupancy was determined by ChIP-seq in WT seedlings and calculated as the log2 fold change between H2A.Z ChIP and IgG control sample. b, AnnoJ genome browser screenshot visualizes the light quality-dependent H2A.Z occupancy at the COL5 gene at ZT0, ZT8 and ZT16. The WT IgG track serves as a control and all tracks were normalized to their sequencing depth. c, Quantification of H2A.Z levels at the gene body of COL5 is shown. Occupancy of H2A.Z was determined by ChIP-seq in one experiment and calculated as the ratio between H2A.Z and IgG control. d, Schematic overview illustrates the experimental setup that was used to investigate chromatin dynamics in low R:FR light responses for experiments shown in Figure 3c to e. e,f, Alternative presentation of results shown in Figure 3c and 3d. Aggregated profiles visualize low R:FR-induced H2A.Z loss and incorporation after two hours of low R:FR exposure (e), and after an additional two-hour-long WL recovery phase (f). Profiles are shown for genes that are differentially expressed after two hours of low R:FR exposure.
