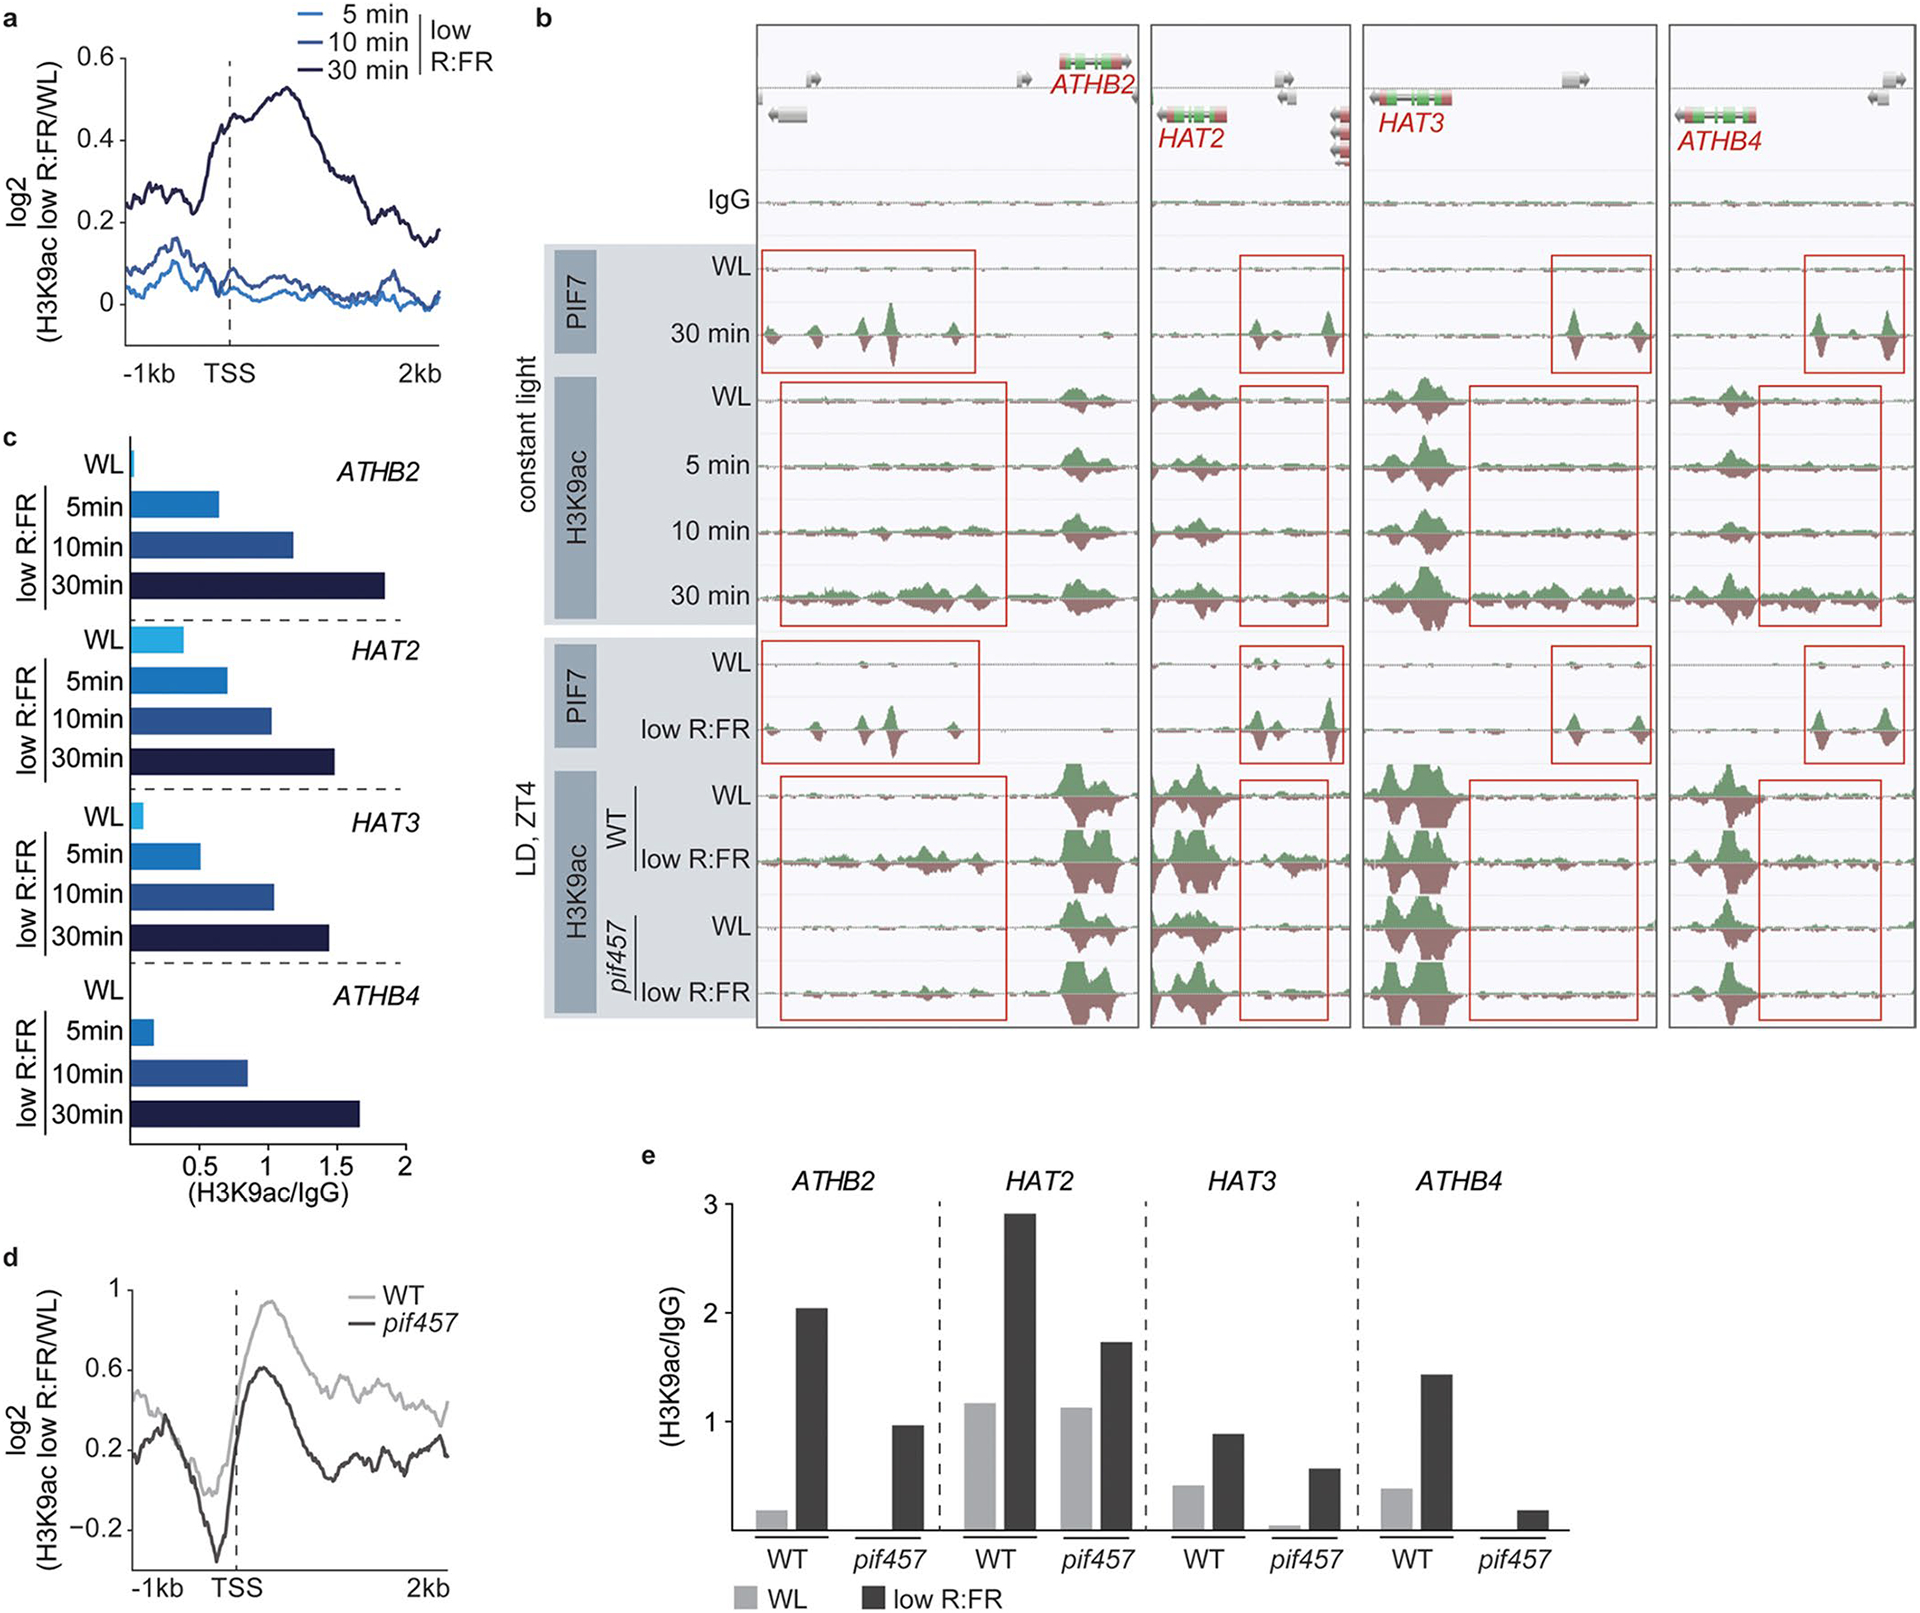
Extended Data Fig. 4 |. Low R:FR induced H3K9 hyperacetylation depends on PIFs.

a, Aggregated profiles visualize the increase of H3K9ac at the most dynamic 200 genes after short low R:FR exposures (5, 10 and 30 min). H3K9ac occupancy was determined in WL and low R:FR-exposed pif457 PIF7:PIF7:4xMYC seedlings by ChIP-seq and was calculated as the ratio between WL and low R:FR-treated H3K9ac ChIP-seq samples. b, AnnoJ genome browser screenshot visualizes PIF7 binding and H3K9 acetylation at the ATHB2 gene and its closest relatives (ATHB4, HAT2, HAT3). Genome-wide occupancy of PIF7 and H3K9ac under constant light conditions was determined in the same pif457 PIF7:PIF7:4xMYC chromatin by ChIP-seq whereas under LD conditions at ZT4, WT (H3K9ac), pif457 (H3K9ac) and pif457 PIF7:PIF7:4xMYC (PIF7) chromatin was used. All tracks were normalized to the respective sequencing depth. The areas marked in red indicate PIF7 binding and H3K9 hyperacetylation. c, Quantification of relative H3K9ac levels at the promoters of ATHB2, ATHB4, HAT2 and HAT3 in low R:FR-exposed pif457 PIF7:PIF7:4xMYC seedlings. H3K9ac occupancy was calculated as the ratio between the respective ChIP-seq sample from one experiment and the WT IgG control. d, Aggregated profiles visualize the increase of H3K9ac at the most dynamic 200 genes after 4 hours of low R:FR exposure at ZT4. H3K9ac occupancy was determined in WL and low R:FR-exposed WT and pif457 seedlings by ChIP-seq and was calculated as the ratio between WL and low R:FR-treated H3K9ac ChIP-seq samples. e, Quantification of relative H3K9ac levels at the promoters of ATHB2, ATHB4, HAT2 and HAT3 in WL and low R:FR-exposed WT and pif457 seedlings. H3K9ac occupancy was calculated from one experiment as the ratio between the H2A.Z ChIP-seq sample and the WT IgG control.
