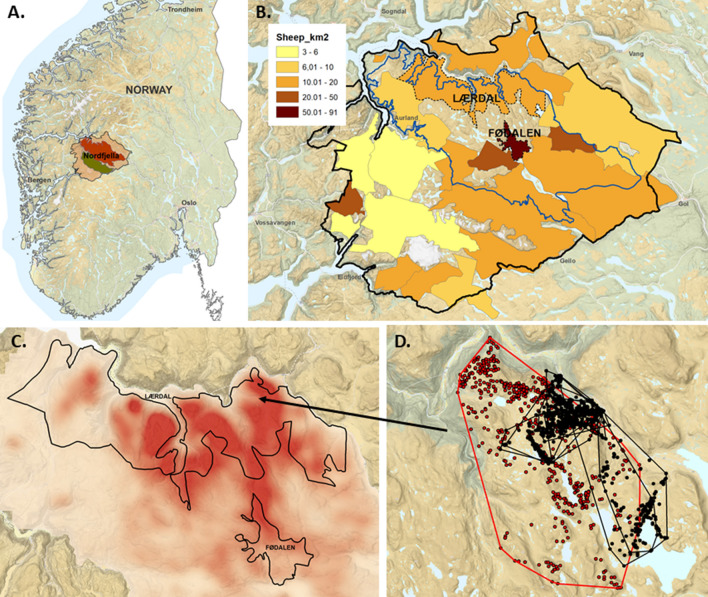
Fig. 1.
Nordfjella CWD management area, sheep and reindeer density and movements A. Location of Nordfjella CWD management area in Norway. Zone 1 is marked in red and zone 2 is marked in green. B Density of sheep released within the sheep grazing districts of Nordfjella in the spring of 2017. The zone 1 reindeer management area is outlined in blue. The sheep grazing districts Fødalen and Lærdal where the sampled sheep were grazing are marked with dotted black lines (Data source: Organisert beitebruk/NIBIO, https://kilden.nibio.no). C Estimated reindeer area use in Nordfjella zone 1 based on GPS locations from marked reindeer (26 females and 5 males) during 2007–2018. The more intense the red color, the more intense the area use. Sheep grazing districts Lærdal and Fødalen are marked with solid black lines. D GPS locations of adult female sheep (n = 5, corresponding to 10 individual grazing seasons) from the Lærdal grazing district included in the study (black dots and lines) and a CWD-positive reindeer that was marked on the 29th of March and culled the 21st of June 2017 (red dots and lines) showing overlapping area use. The dots in this figure represent individual positions of the animals, while the lines show the borders of the total area that was used by an individual animal per season

