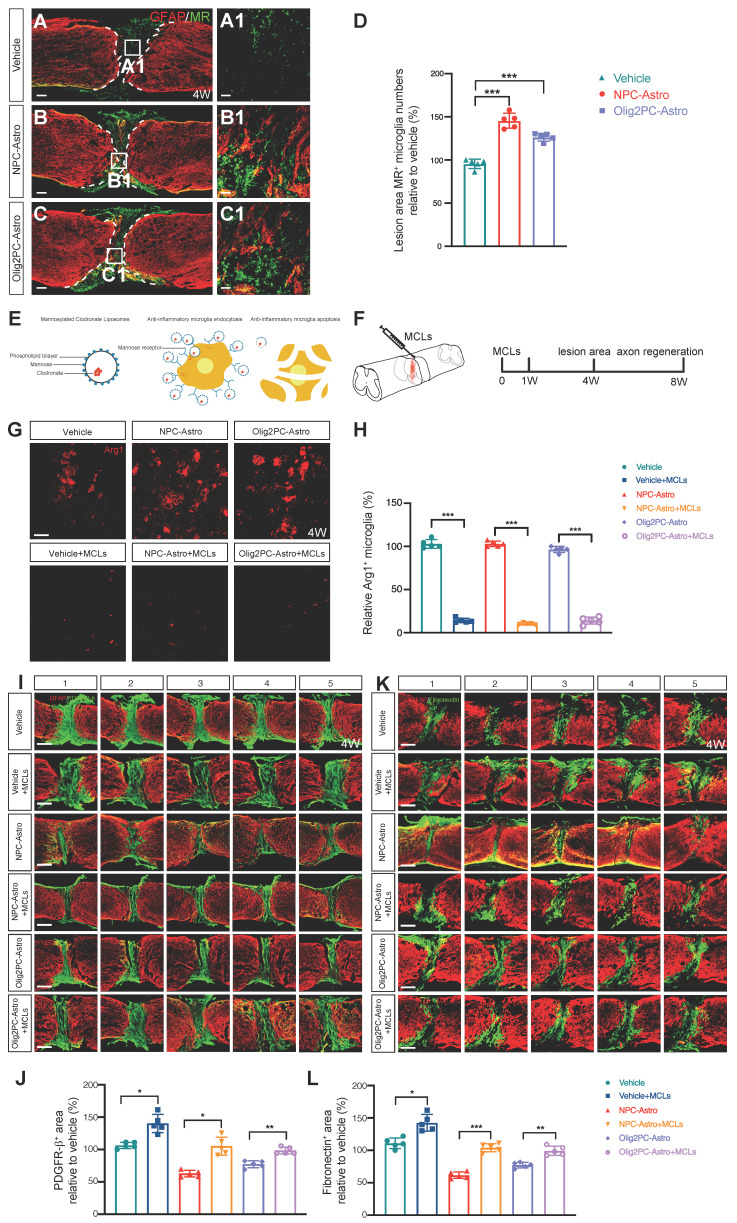
Figure 6.
Depletion of anti-inflammatory microglia inhibits reduction of lesion area. (A-C) Representative images showing GFAP (red) and MR (green) staining in spinal cord sagittal sections at 4 weeks post-transplantation. A1-C1 are higher magnification images of boxed areas in A-C. Scale bars: 200 μm (A-C), 20 μm (A1-C1). (D) Quantification of MR+ cells at 4 weeks post-transplantation (n = 5 per group). Brown-Forsythe and Welch ANOVA followed by Dunnett's T3 multiple comparisons test. Data are mean ± SD; ***p < 0.001. (E) Schematic of depletion of anti-inflammatory microglia using mannosylated clodronate liposomes. (F) Experimental design: evaluation of lesion area at 4 weeks and axon regeneration at 8 weeks after MCL injection. (G) Representative images showing Arg1(red) staining in sagittal sections of spinal cord lesion area at 4 weeks post-transplantation. Scale bar: 20 μm. (H) Quantification of efficiency of anti-inflammatory microglia depletion (n = 5 per group). Unpaired t test with Welch's correction. Data are mean ± SD; ***p < 0.001. (I, K) Representative images showing five consecutive parasagittal sections centered at the spinal cord midline at 4 weeks post-transplantation. Sections are stained for GFAP (red) to demarcate glial scar borders and lesion areas plus either PDGFR-β to label pericyte (I, green) or fibronectin to label fibroblast (K, green). Scale bars: 200 μm. (J, L) Quantification of PDGFR-β+ (J) and fibronectin+ (L) area (n = 5 per group). Brown-Forsythe and Welch ANOVA followed by Dunnett's T3 multiple comparisons test. Data are mean ± SD; *p < 0.05, **p < 0.01, ***p < 0.001.

