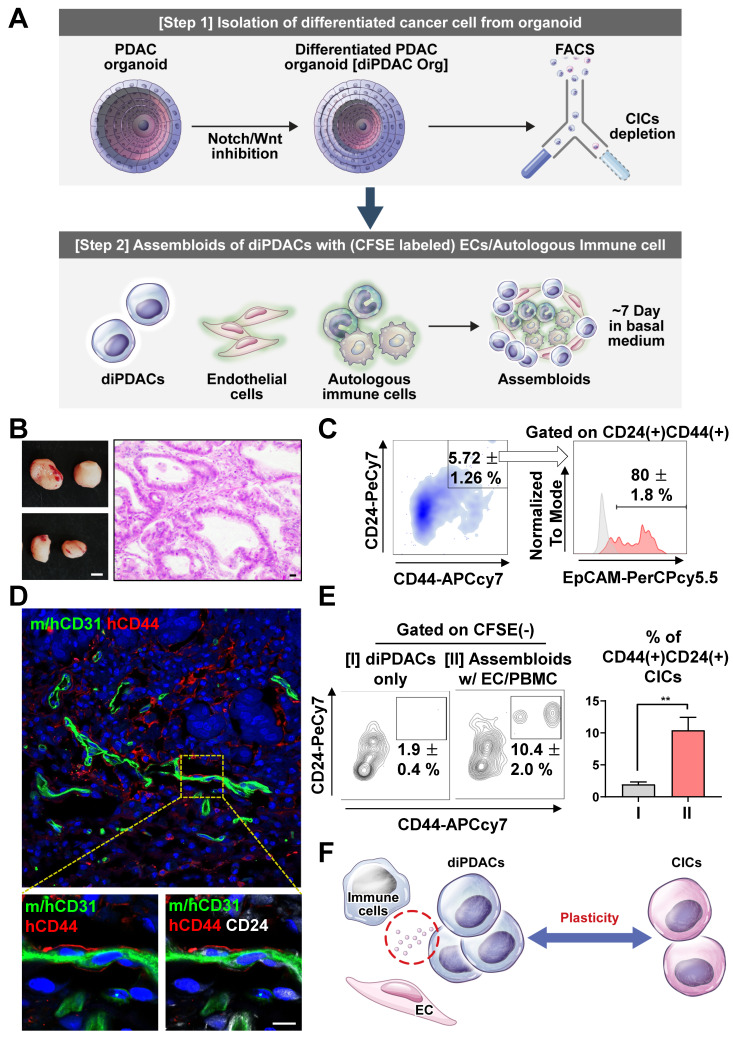
Figure 2.
Differentiated CD44(-) cancer cells from PDAC organoids reprogrammed as CICs by endothelial cells and immune cells. (A) Schematic figure of the experiment. [Step 1] Isolation of differentiated cancer cells from PDAC organoids after culture in the differentiation condition. [Step 2] Establishment of assembloids with differentiated cancer cells, endothelial cells, and autologous immune cells, followed by culture for 7 days in basal medium. [Step 3] Analysis of the cancer cell plasticity capacity in vivo and in vitro. (B-D) Xenotransplantation of assembloids after culture in basal medium. (B) (Left) Tumor mass image. Scale bar, 5 mm. (Right) H&E staining. Scale bar 20 μm, (C) Representative FACS plot showing CD24(+)CD44(+) and CD24(+)CD44(+)EpCAM(+) CIC populations from tumor mass. (D) Frozen section image of m/hCD31 (green), hCD44 (red), and hCD24 (white). Scale bar, 10 μm. (E) (Left) Analysis of CIC population after 7-day culture of (I) differentiated PDAC cells (diPDACs) and (II) assembloids containing diPDACs/ECs/autologous immune cells. ECs and immune cells labeled with CFSE dye. (Right) Quantification of the CFSE(-)CD24(+)CD44(+) CIC population (N = 3 biological replicates, **P < 0.05, Mann-Whitney U test). (F) Schematic figure for cancer cell plasticity driven by ECs and immune cells.

