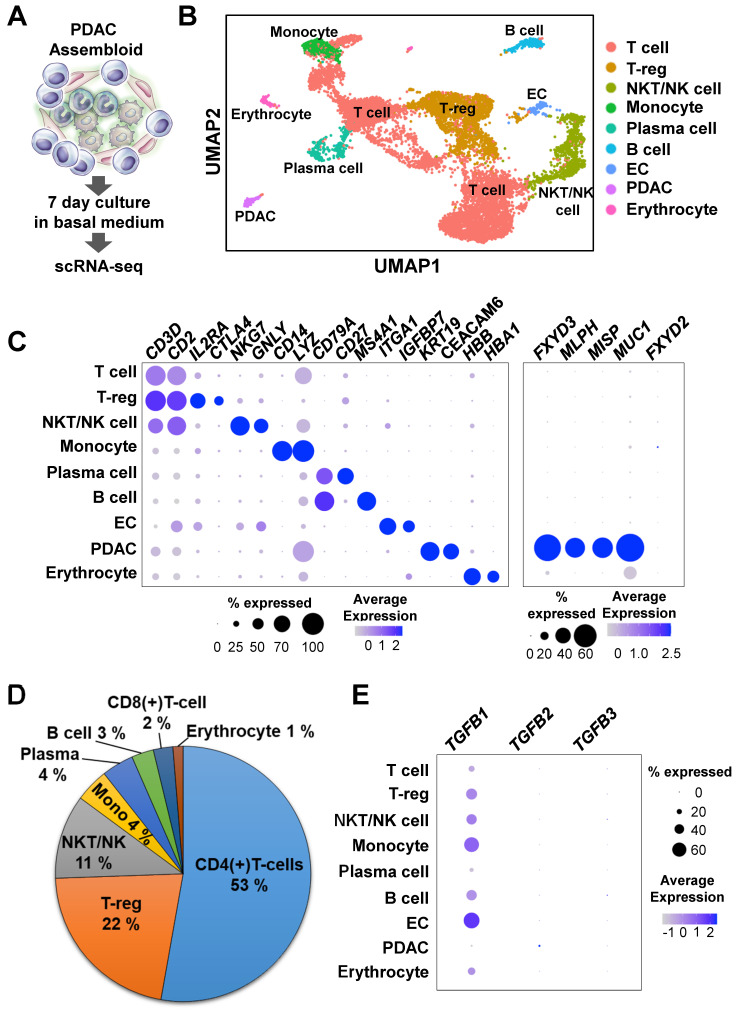
Figure 3.
Single-cell RNA-seq analysis of PDAC assembloids containing endothelial cells and autologous immune cells. (A) Graphical figure of single-cell RNA-seq. (B) Clustering of different cell types. (C) Selective cell type-specific markers are shown in a bubble plot. The dot size indicates the percentage of cells that express a specific marker, and the color intensity represents the level of mean expression. (D) Proportion of immune cells. (E) Bubble plot showing the TGFB1, TGFB2, and TGFB3 levels in different cell types.

