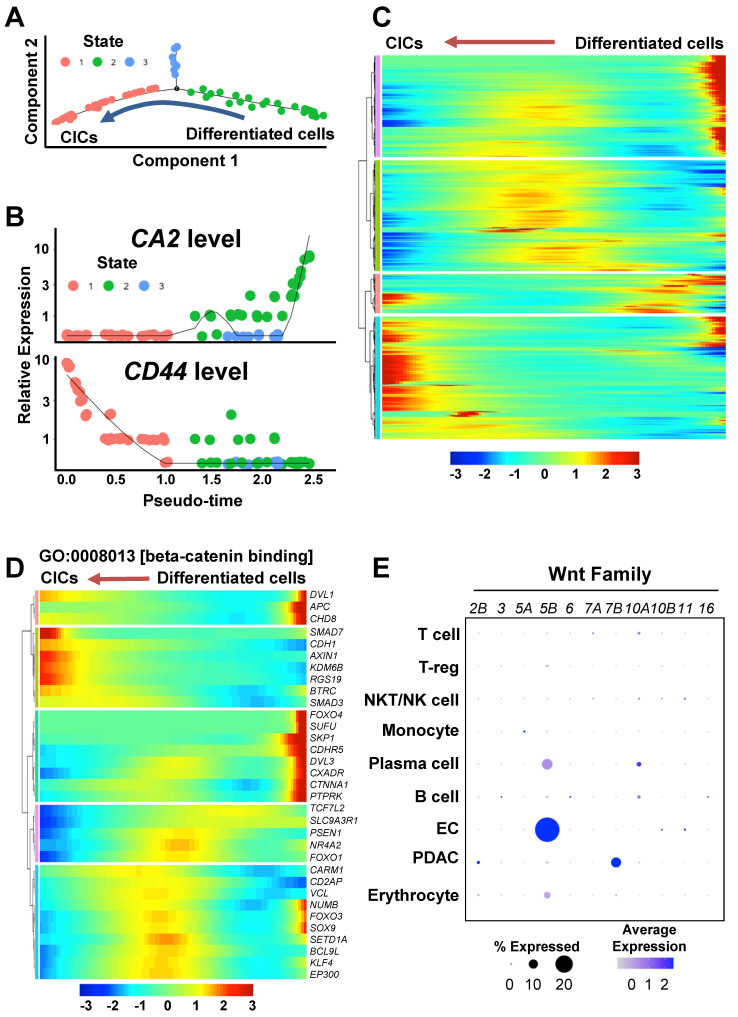
Figure 4.
Wnt/β-catenin pathway during the process of cancer cell plasticity using a trajectory analysis. (A) Trajectory analysis of CICs and differentiated ductal cancer cells in the PDAC cluster in the single-cell RNA-seq dataset. (B) CA2 and CD44 levels in the CICs and differentiated ductal cancer cells in the trajectory analysis. (C) Heatmap of the differentially expressed genes during the reprogramming process. The gene list contains the genes that were significantly regulated in States 1, 2, and 3 (P < 0.05, T-test). (D) Heatmap showing GO:0008013 [β-catenin binding] in the differentially expressed gene list. (E) Expression levels of WNT2B, WNT3, WNT5A, WNT6, WNT7A, WNT7B, WNT10A, WNT10B, WNT11, and WNT16 in the PDAC assembloids.

