Figure 3.
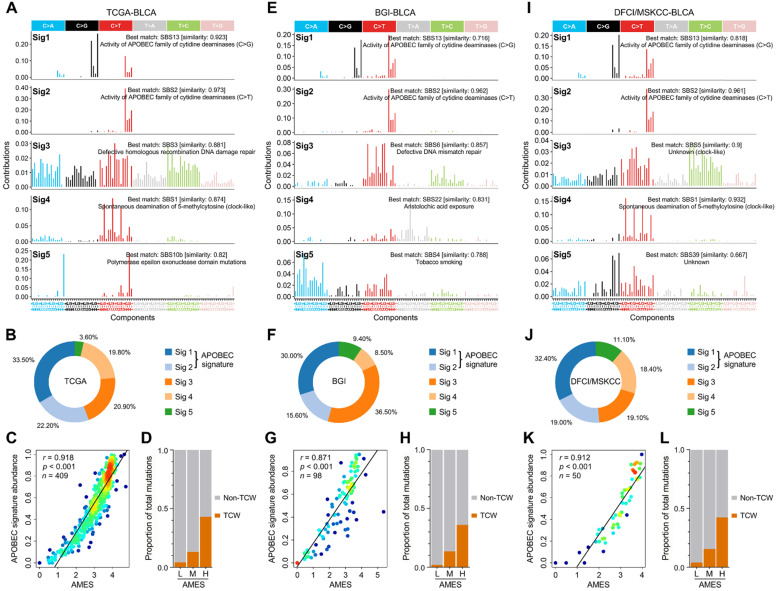
APOBEC mutagenesis dominates in the mutational patterns of BLCA. To decipher mutational signatures in BLCA, three WES cohorts (TCGA-BLCA, BGI-BLCA, and DFCI/MSKCC-BLCA) were included in our study. (A) With the optimal factorization k value (k = 5) in the NMF algorithm, five mutational signatures were identified in the TCGA-BLCA cohort. Signature 1 was annotated as “activity of APOBEC family of cytidine deaminases (C>G)”, and signature 2 “activity of APOBEC family of cytidine deaminases (C>T)”. (B) The relative abundance of each mutational signature in the TCGA cohort was shown in a pie chart, and APOBEC signatures (Sig1 + 2) occupy a dominant position. (C) APOBEC signature abundance shows a highly positive correlation with AMES, (D) and TCW mutations were dramatically elevated as AMES level increased. Similar results were observed in both (E-H) BGI-BLCA and (I-L) DFCI/MSKCC-BLCA cohorts, which further confirmed that APOBEC mutagenesis dominates in BLCA mutational patterns and retains a highly positive correlation with AMES.

