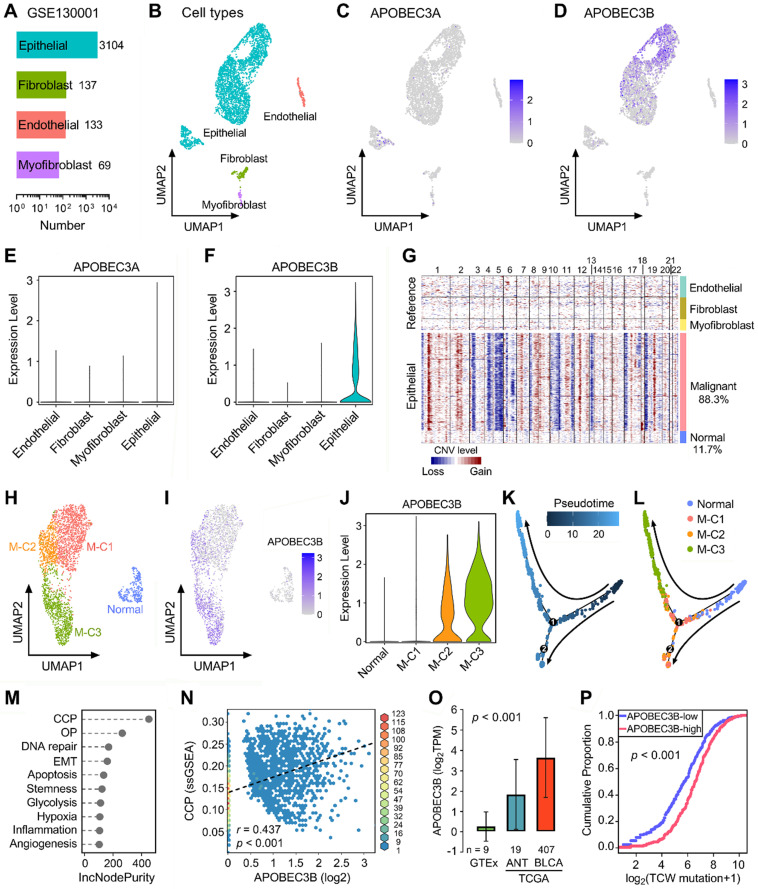
Figure 4.
APOBEC3B is specifically expressed in malignant epithelial cells and correlates with cell cycle progression in BLCA. (A) GSE130001 contains scRNA-seq data of sorted non-immune cells from two BLCA specimens, and cell numbers of four cell types (epithelial, fibroblast, endothelial, and myofibroblast) were summarized. (B) UMAP dimensionality reduction was used to show the distribution and dissimilarity of the four cell types. (C) APOBEC3A is hardly expressed in any cell type, (D) while APOBEC3B is specifically expressed in epithelial cells. (E & F) Violin plots visualized the normalized expression levels of APOBEC3A and APOBEC3B in the four cell types. (G) Malignant cells were distinguished from the total epithelial cells by inferring large-scale CNVs with stromal cells as references, and 88.3% epithelial cells were identified as malignant due to their high chromosome instability. (H) Using UMAP dimensionality reduction, malignant epithelial cells were further divided into three subclusters (M-C1, M-C2, M-C3), (I) and the expression of APOBEC3B was visualized with different color degrees. (J) Violin plot showed that APOBEC3B is hardly expressed in normal epithelial cells and M-C1, but highly expressed in M-C2 and M-C3. (K) A pseudotime trajectory was plotted to describe the evolution of epithelial cells, and the arrows indicated the putative developmental directions. (L) The progression trajectory originated from normal epithelial cells and developed into two main branches where M-C3 cells located at the top-left corner and M-C1 & C2 located at the lower-left corner. (M) The ssGSEA and random forest algorithms jointly demonstrated that cell cycle progression (CCP) acts as the most important hallmark of cancer among the three subclusters. OP: oxidative phosphorylation. (N) In all malignant epithelial cells, APOBEC3B exhibited a significantly positive correlation with CCP score (r = 0.437, p < 0.001). (O) APOBEC3B was stepwisely and significantly elevated as specimens from normal bladder tissues to ANT, and to BLCA (p < 0.001). (P) Cumulative proportion curves showed that the higher-APOBEC3B group (red curve) was continuously distributed at the right side of the lower-APOBEC3B group (blue curve), indicating APOBEC3B contributes substantially to TCW mutations in BLCA.

