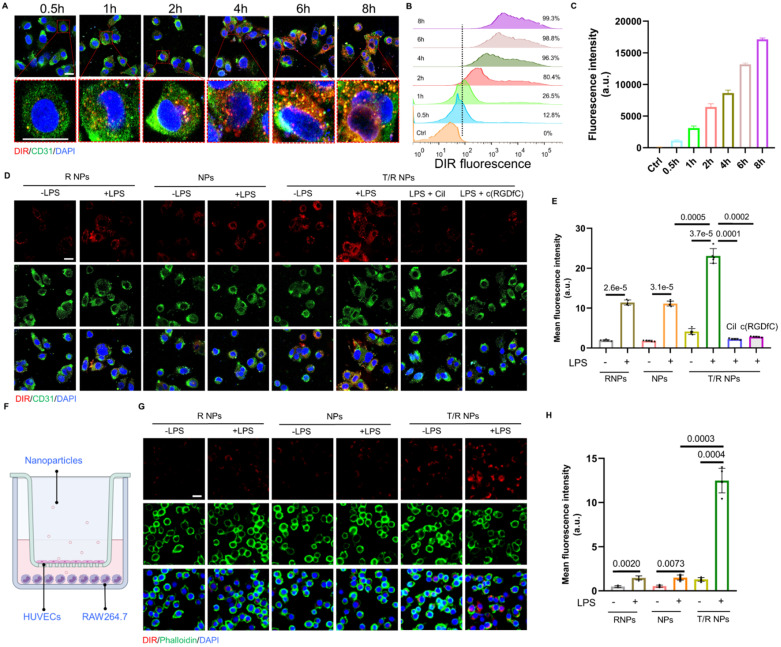
Figure 3.
Cellular uptake of T/R NPs in HUVECs and trans-endothelial transport capacity of T/R NPs. (A) Confocal microscopy image of time-dependent cellular uptake of DIR@T/R NP (Scale bar: 20 µm). (B) Flow cytometry analysis of HUVECs uptake of DIR@T/R NPs. (C) Quantification of cellular uptake of DIR@T/R NPs in HUVECs at different time points (n = 3). (D) Cellular uptake of DIR@T/R NPs in HUVECs in the presence or absence of LPS as demonstrated by CLSM (Scale bar: 20 µm) and their mean fluorescence intensity (E) (n = 3). (F) Schematic illustration of the coculture model used. (G) Confocal microscopy images and mean fluorescence intensity (H) of DIR@T/R NPs in RAW264.7 cells in the bottom chamber (Scale bar: 20 µm) (n = 3).

