Figure 6.
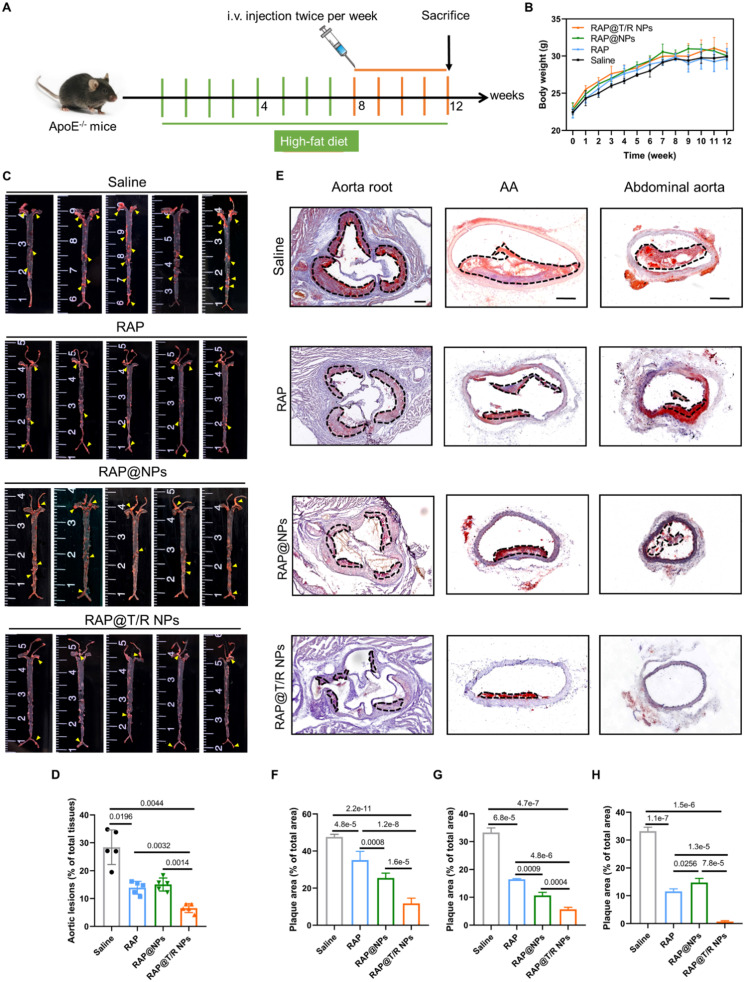
Therapeutic effects of i.v. administration of RAP@T/R NPs in ApoE-/- mice. (A) Schematic illustration of the treatment protocols. (B) The body weight changes in ApoE-/- mice were treated with various formulations (n = 15). (C) En face ORO-staining of aortas from ApoE-/- mice after treatment with different formulations (saline, RAP, RAP@NPs, RAP@T/R NPs at a dose of 0.5 mg/kg RAP twice a week, n = 5, plaque lesions: yellow arrowheads). (D) Quantitative analysis of lesion area in aorta tissues (n = 5). (E) ORO-stained cryosections of the aortic root, AA, and abdominal aorta (plaque lesions: dotted frame, Scale bar: 200 µm, n = 5). (F-H) Quantitative analysis of the relative plaque area in sections of the aortic root (F), AA (G), and abdominal aorta (H) (n = 4-5).

