Figure 1.
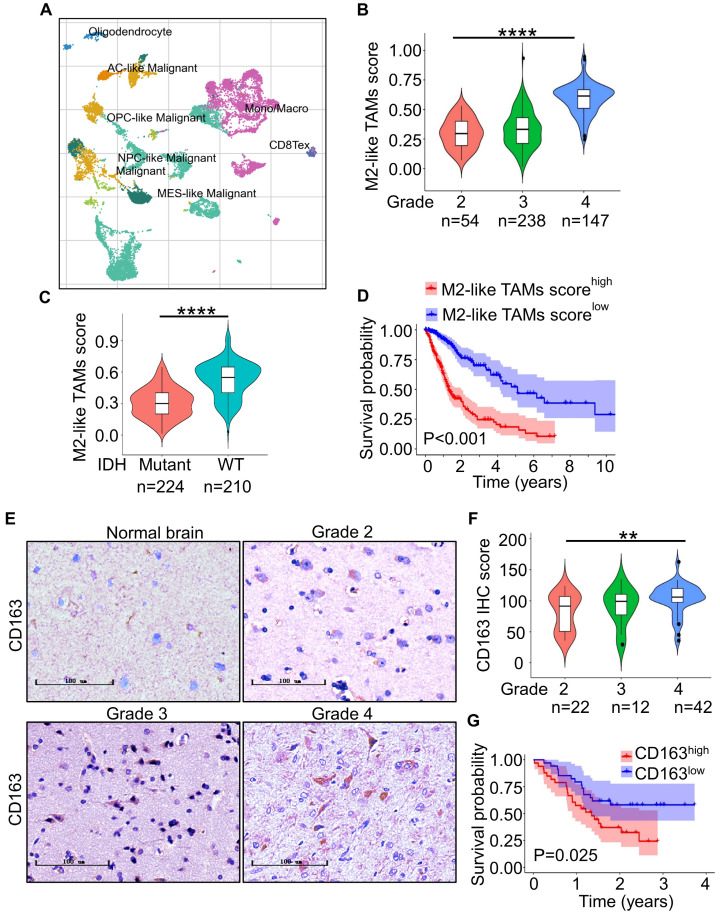
M2-like TAMs infiltrate more in high-grade gliomas. (A) t-SNE analysis of 13553 cells of nine glioma patients (GSE131928) showed TAMs accounted for 29.3% of total cells 38. (B) ssGSEA of M2-like TAMs signature genes in TCGA-glioma dataset showed M2-like TAMs signature score increased with higher grade gliomas. ****P ˂ 0.0001, ANOVA, analysis of variance. (C) Violin plot of M2-like TAMs signature score in IDH-WT and IDH-mutant gliomas from the TCGA database. ****P < 0.0001, Student's t-test. (D) Kaplan-Meier survival plots of M2-like TAMs signature score showed a higher score indicated a poorer prognosis. P ˂ 0.001, log-rank test. (E) Representative IHC staining of CD163 in glioma microarray. Scale bar represents 20 µm. (F) Quantification of the IHC images demonstrated that the score of CD163 increased with increasing WHO grade. **P < 0.01, ANOVA, analysis of variance. (G) Kaplan-Meier survival plot of CD163 expression of glioma patients from the glioma microarray. P = 0.025, log-rank test.

