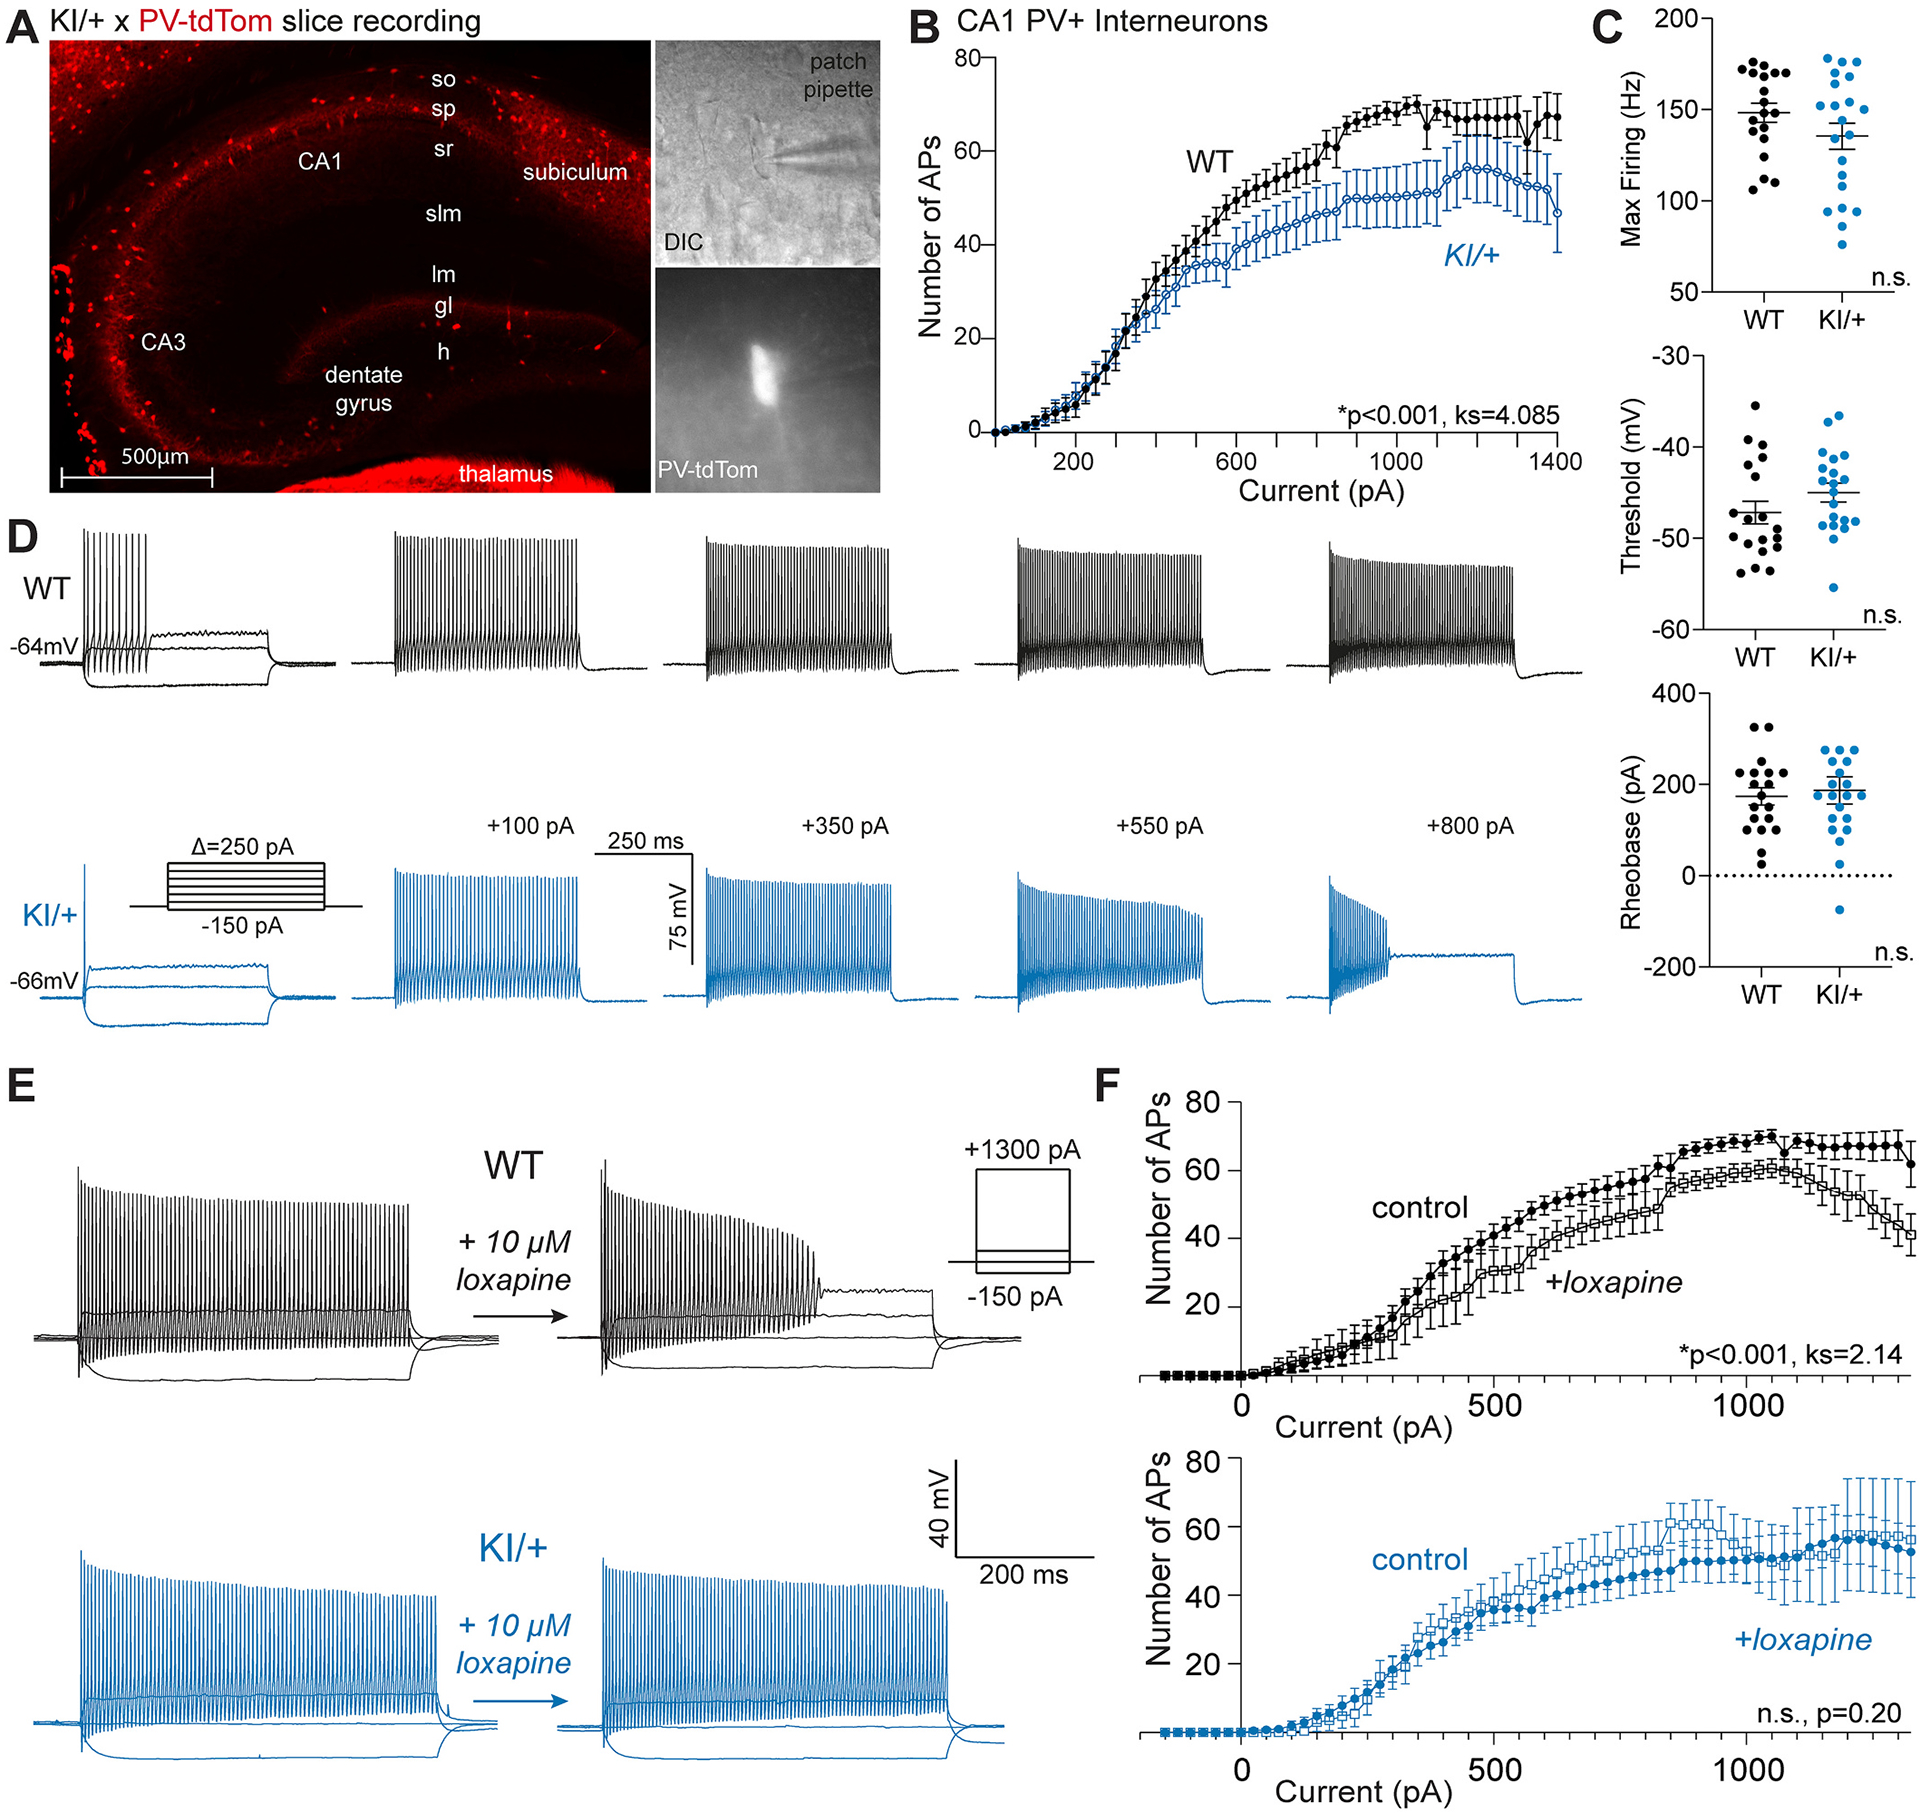
Fig. 6.

KNa1.1 gain-of-function dampens intrinsic excitability of CA1 PV+ interneurons. (A) Image showing PV+ interneurons (red) in a hippocampal slice from a KI/+ X PV-tdTomato mouse (left). Bright field image (60× magnification) of recorded PV+ interneuron (top, right) and tdTomato-positive image of the same cell (60×, bottom right). (B) Plot showing number of action potentials vs current injected comparing PV+ interneurons from different genotypes (WT, n = 19; KI/+, n = 21). The F–I relationships are significantly different (ks = 4.085, p < 0.001); Kolmogorov-Smirnov test). (C) Plots comparing maximum (Max) firing frequency, threshold potential, and rheobase current for PV+ interneurons between WT and KI/+ mice (WT, n = 19; KI/+, n = 21). (D) Current clamp recordings from single PV+ interneurons in acute hippocampal slices from WT (top, black) or KI/+ (bottom, blue) mice. Table S2 provides a summary of intrinsic electrophysiological properties of these neurons. Data shown are mean ± SEM. (E) Representative current clamp recordings from WT and KI/+ CA1 PV+ interneurons before and after exposure to 10 μM loxapine. Insets illustrate the voltage protocol and scale bars. (F) Comparisons of the number of action potentials evoked by varying injected current between control and loxapine treated CA1 PV+ interneurons from WT (control, n = 19; loxapine, n = 7) and KI/+ (control, n = 21; loxapine, n = 8) mice. Statistical differences between control and loxapine treated groups were determined by the Kolmogorov-Smirnov test and p-values are included in panels. Tables S1 and S2provide summaries of intrinsic electrophysiological properties of neurons measured in the absence and presence of loxapine.
