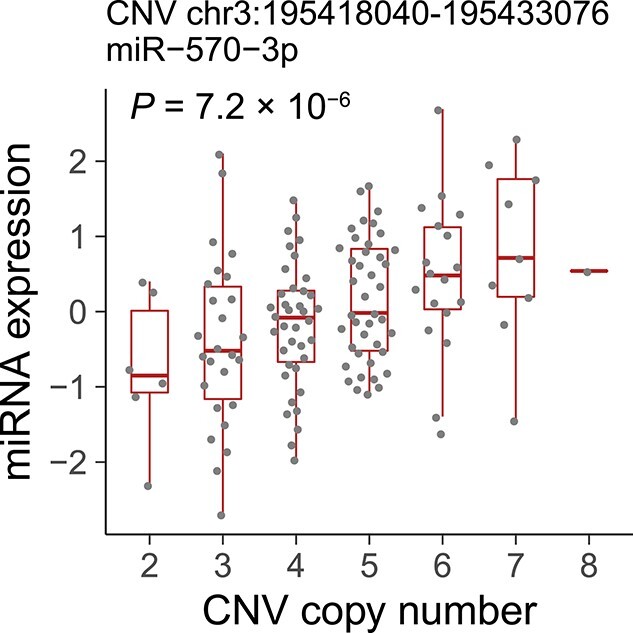
Figure 4.

Positive correlation between genomic copy number and miRNA expression. The significant association between the genomic copy number of the CNV chr3:195418040–195 433 076 (x-axis) and the normalized expression of miR-570-3p (y-axis). Each dot represents a normalized expression in a given individual. Boxplots represent IQR, and ends of whiskers represent the minimum and maximum values within 1.5 × IQR.
