Figure 6.
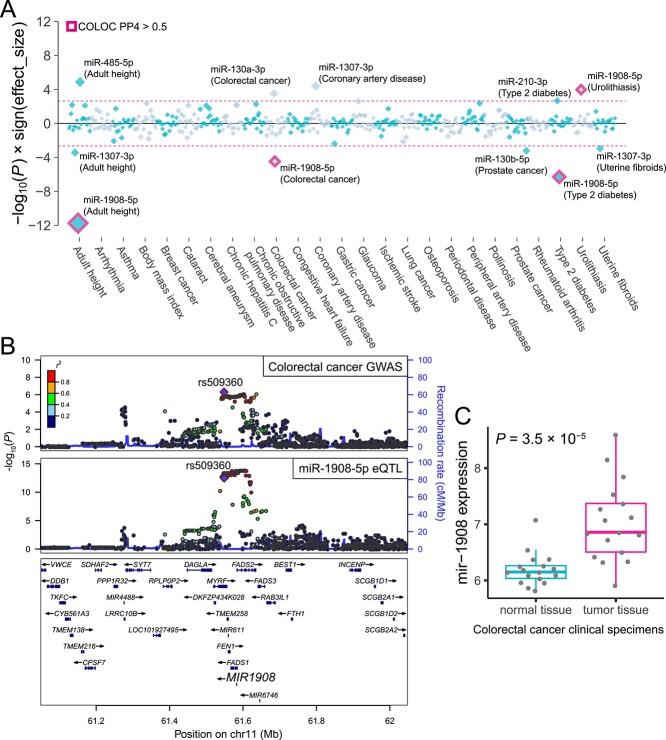
MiRNA TWAS for complex diseases and anthropometric traits. (A) P-values are shown for associations between genetically regulated miRNA expression and complex traits. Each diamond represents the P-value for a given miRNA–trait pair. The y-axis indicates −log10(P) with the sign of the effect sizes to represent the direction of the miRNA effects. Pink-dashed lines indicate the transcriptome-wide significance threshold via the Bonferroni correction based on the number of tested miRNAs. The miRNA–trait pairs meeting the significance threshold are labeled. The miRNA–trait pairs with COLOC PP4 > 0.5 are highlighted in pink. (B) Regional plots of colorectal cancer GWAS and miR-1908 eQTL are shown. Markers are colored by LD (r2) with the lead variant of the GWAS (rs509360). (C) The pre-miRNA mir-1908 expressions in normal and tumor tissues from colorectal cancer patients are shown (45). Each dot represents a normalized expression of mir-1908 in a given specimen sample. Boxplots represent IQR, and ends of whiskers represent the minimum and maximum values within 1.5 × IQR.

