Figure 2.
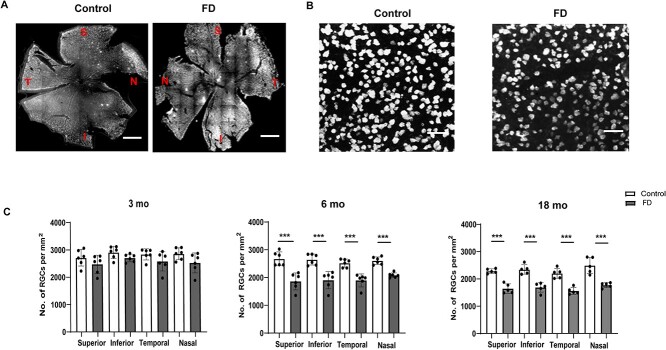
Progressive degeneration of RGCs in the phenotypic FD mouse model. Representative retinal whole-mount images from control and FD mice stained with RGC marker RBPMS. Scale bars, 100 μm. RPBMS+ cells in control and FD retinae were counted in each quadrant in superior (S), inferior (I), nasal (N) and temporal regions at 1 mm from the optic nerve head (ONH) at 3, 6 and 18 months of age. Scale bars, 350 μm. (B) Higher magnification representative RPBMS staining images of control and FD retinae. Scale bars, 100 μm. (C) Bar plots of RPBMS+ cell counts in 3 month- (n = 5), 6 month- (n = 6) and 18-month-old (n = 6) retinae from control and FD mice. Significant reduction in the number of RGCs was observed starting at 6 months of age and progresses at 18 months in FD mice compared to control mice. Gray bars represent FD and white bars represent control mice. *P < 0.05, **P < 0.01 and ***P < 0.001. Error bars represent SEM. P value was calculated using students t-test.

