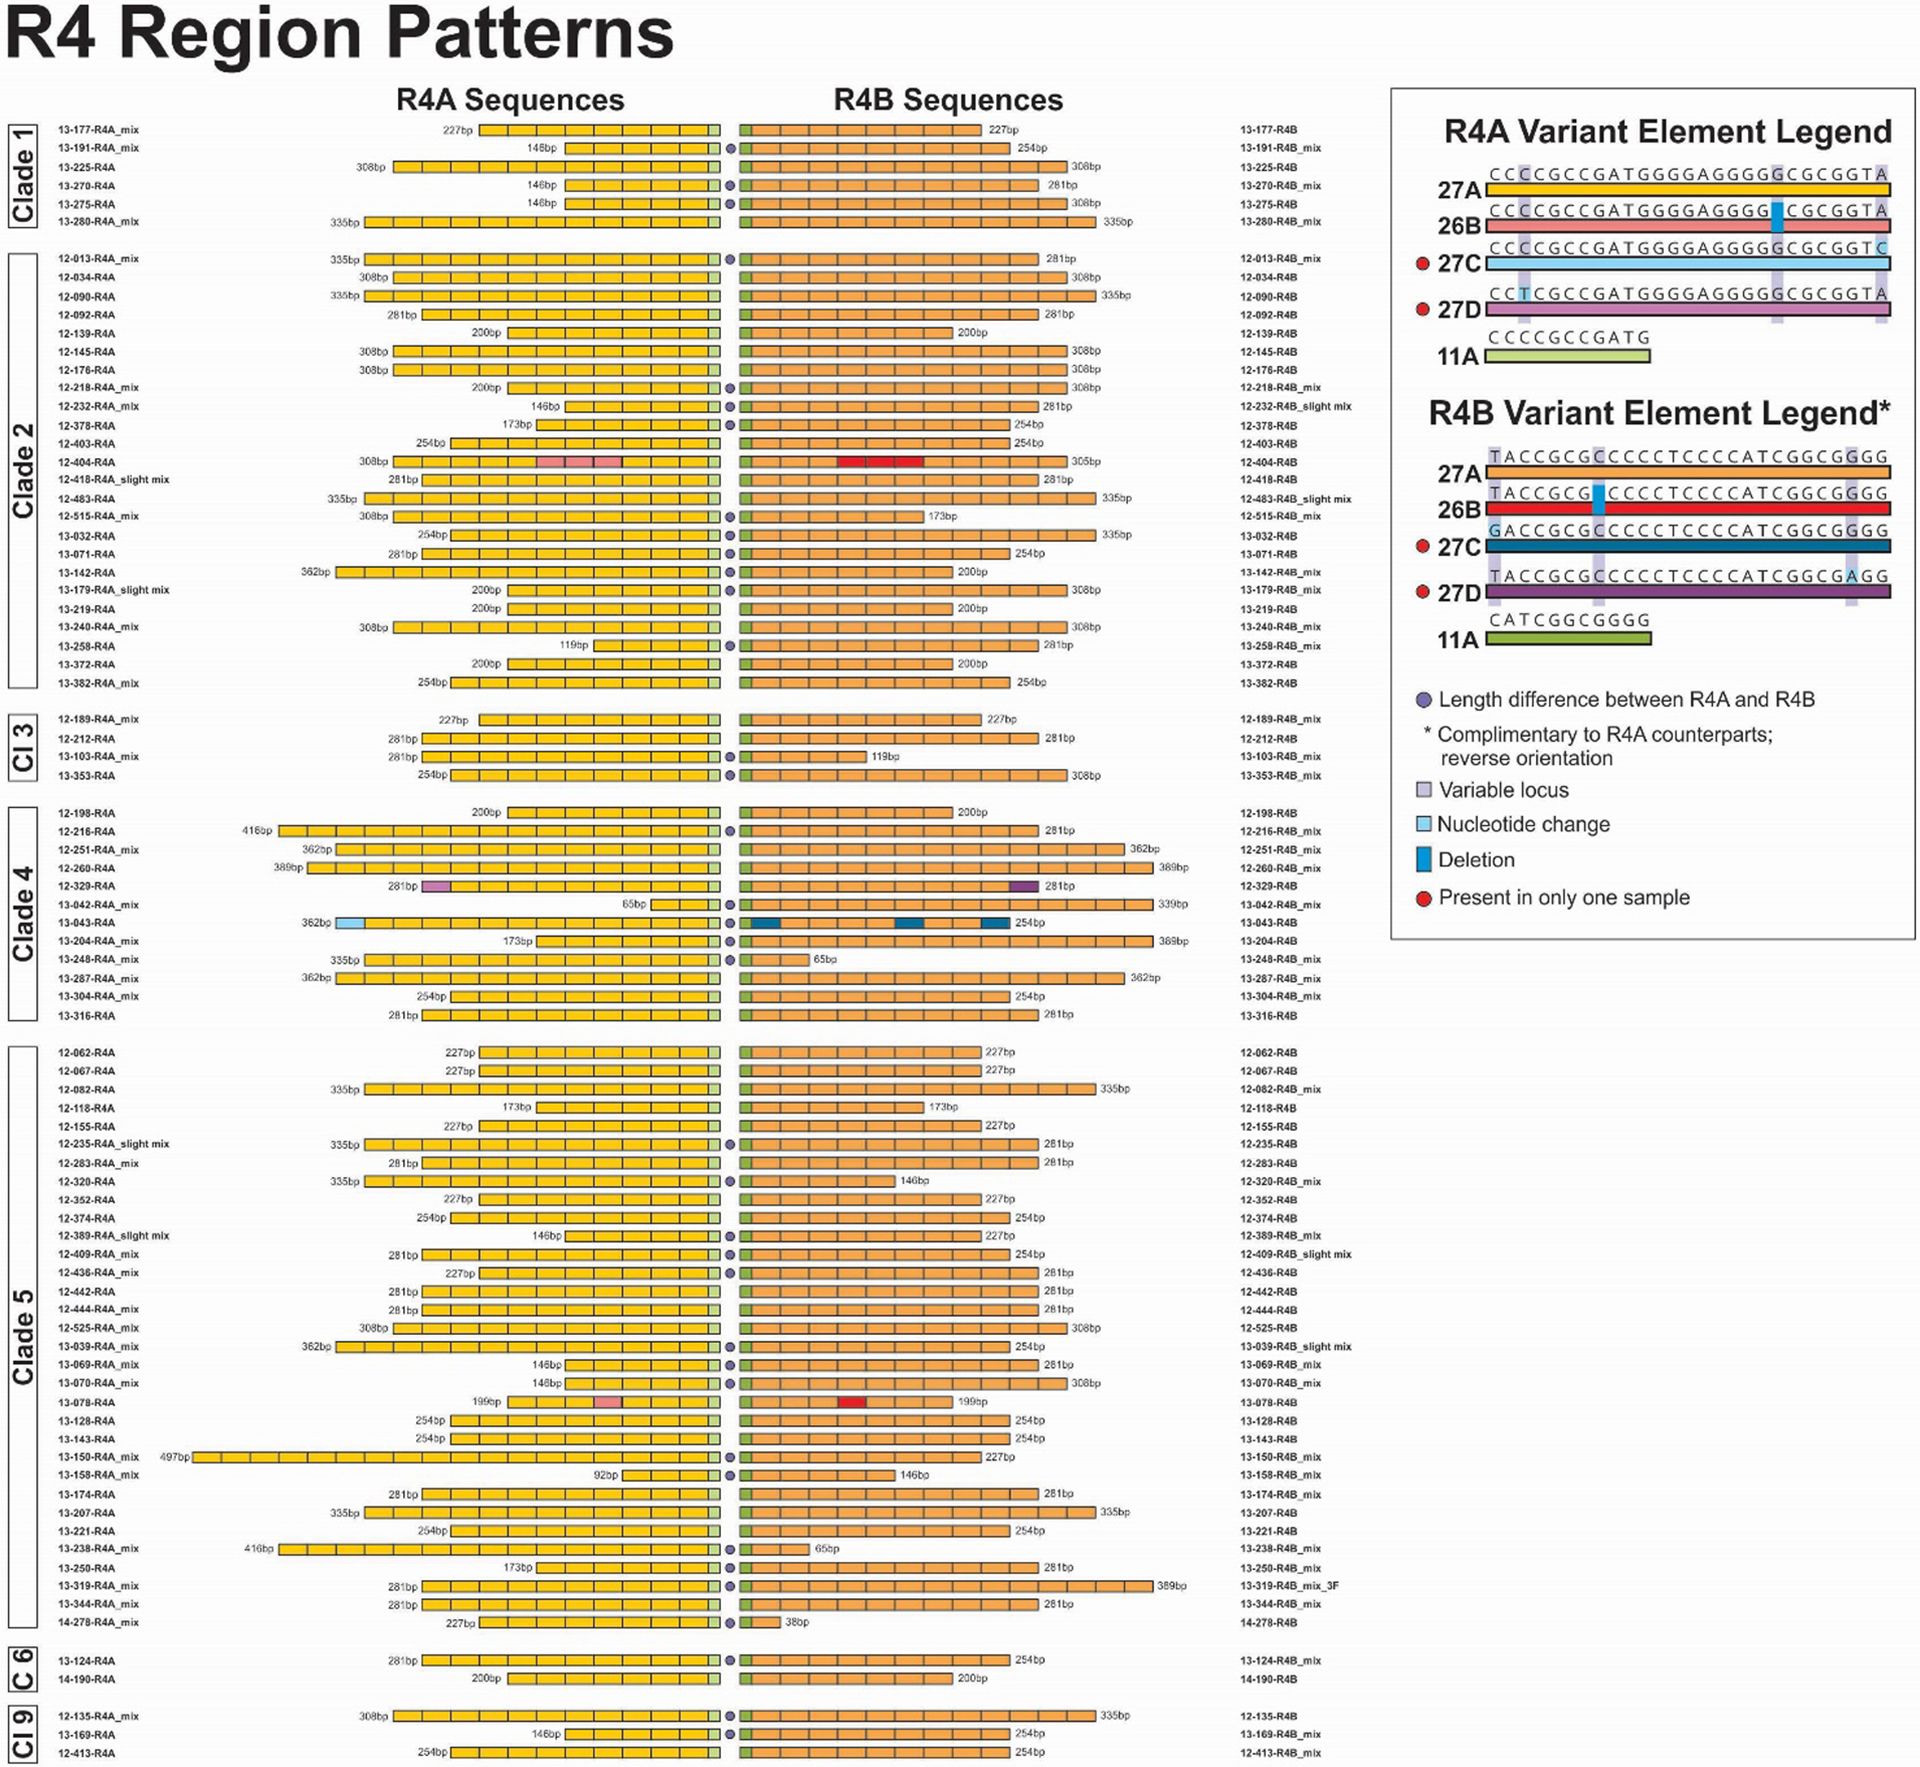
Figure 8.

Pairwise comparison of R4A and R4B variant element patterns for study samples grouped by VZV clade. Representations of all elements are scaled to reflect the relative actual length in base pairs. For R regions with mixtures the sequences with the strongest chromatogram signal are represented in the figure.
