
FIGURE 1.
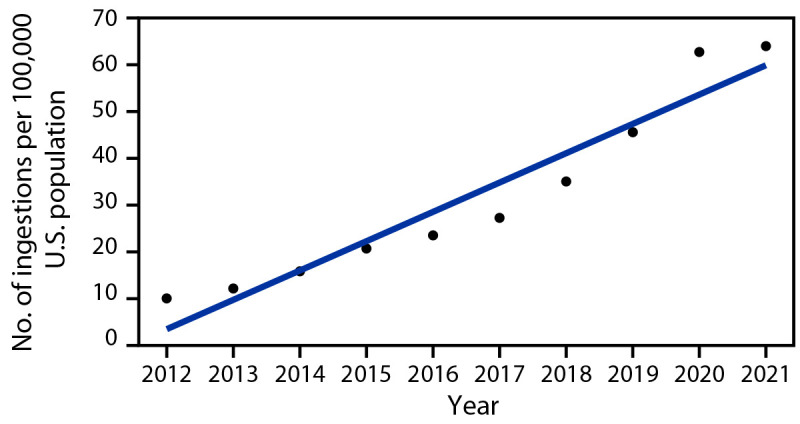
Rate* of pediatric† melatonin ingestions reported to poison control centers, by year§ — United States, 2012–2021
* Ingestions per 100,000 population, based on U.S. Census Bureau Annual Estimate.
† Aged ≤19 years.
§ Linear trend, p<0.001.
Official websites use .gov
A
.gov website belongs to an official
government organization in the United States.
Secure .gov websites use HTTPS
A lock (
) or https:// means you've safely
connected to the .gov website. Share sensitive
information only on official, secure websites.
Rate* of pediatric† melatonin ingestions reported to poison control centers, by year§ — United States, 2012–2021
* Ingestions per 100,000 population, based on U.S. Census Bureau Annual Estimate.
† Aged ≤19 years.
§ Linear trend, p<0.001.