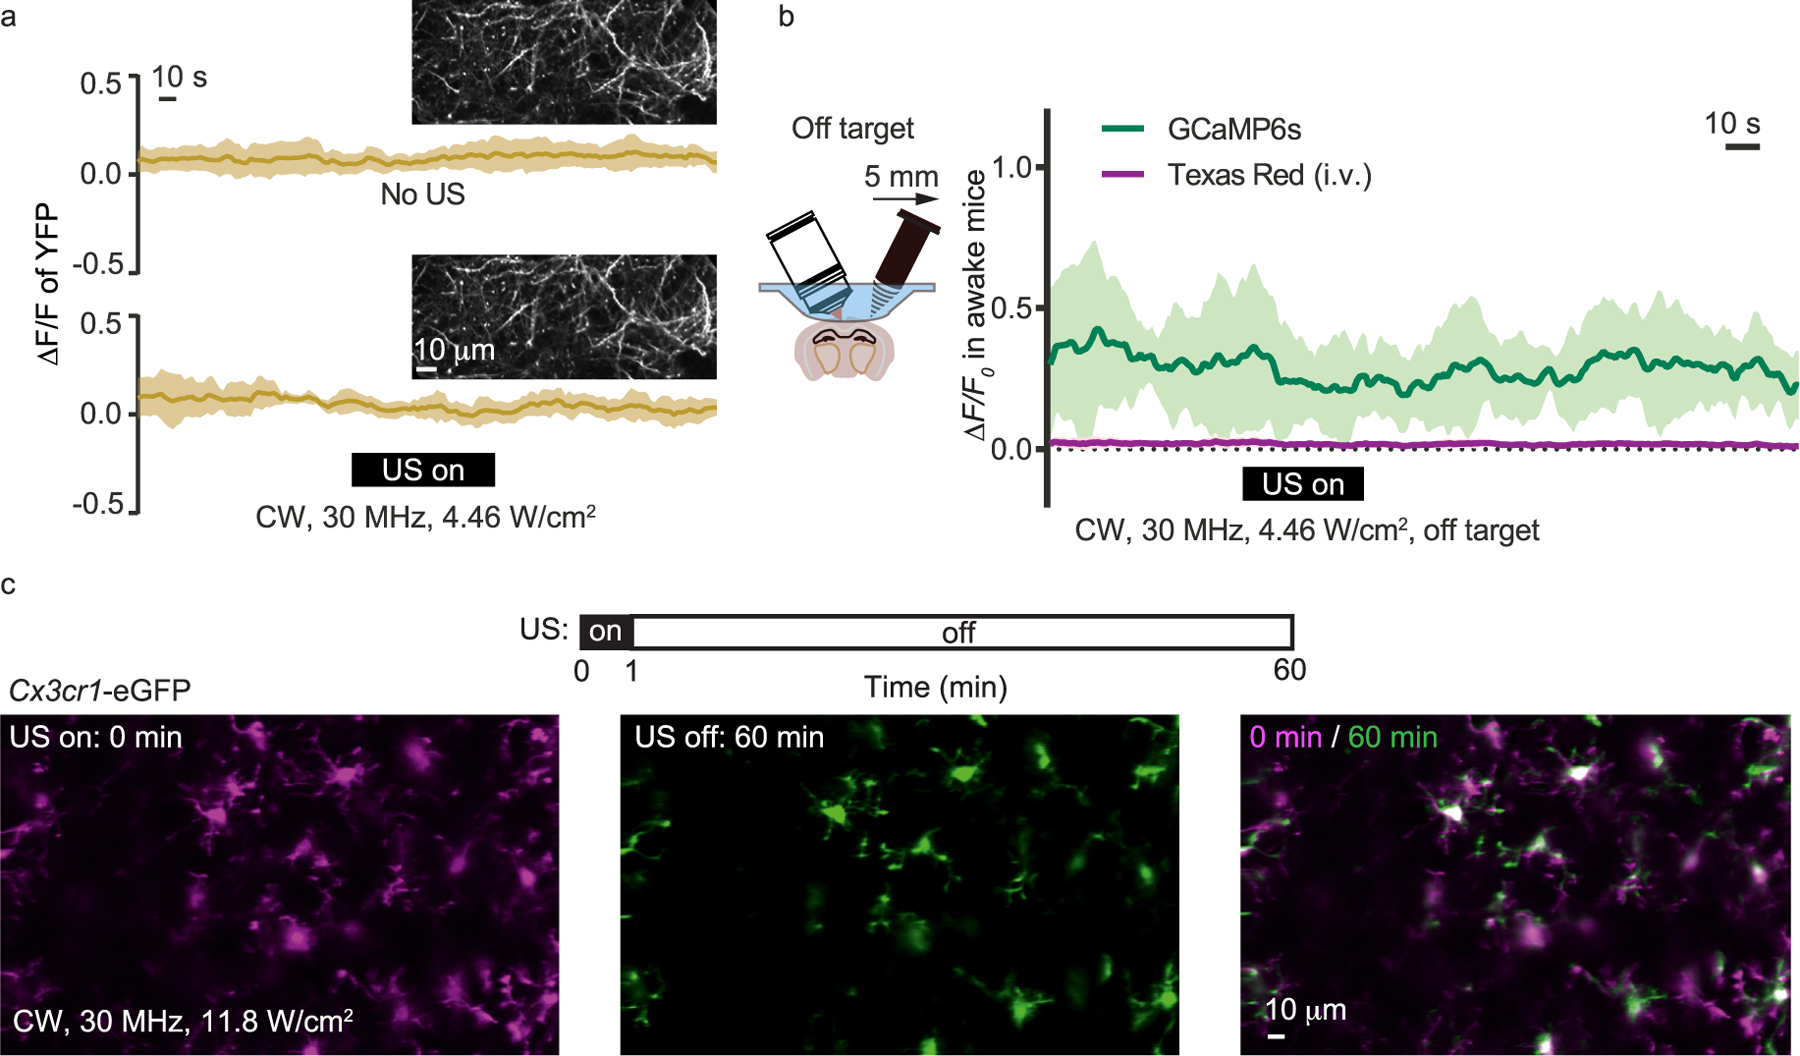
Fig. 4.

Control studies with YFP, GCaMP6s and Cx3cr1 mice. (a) Fluorescence signal of the Thy1-YFP expressing neurons without and with the 30 MHz ultrasound modulation. (b) Calcium imaging with the ultrasound transducer moved 5 mm away from the imaging region. The blood vessels were also visualized by the Texas Red labeling. (c) Cx3cr1-EGFP mice imaging with ultrasound modulation. The applied ultrasound intensity (11.8 W/cm2) was significantly greater than the typical value used in this study. (For interpretation of the references to colour in this figure legend, the reader is referred to the Web version of this article.)
