Fig. 5.

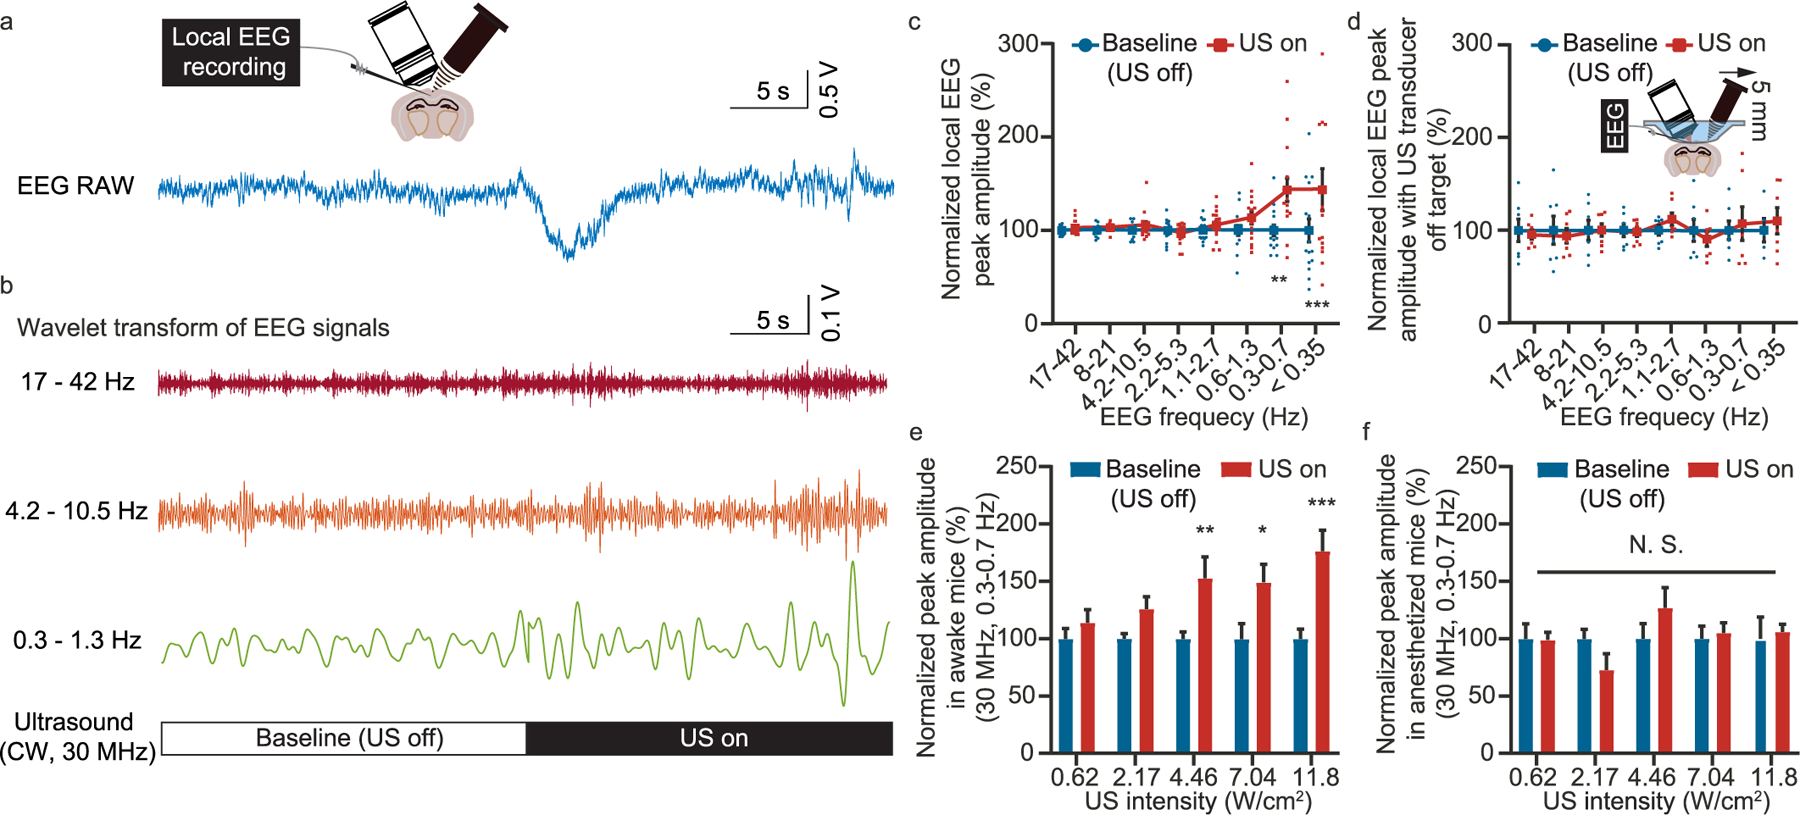
Simultaneous EEG recording during high-frequency ultrasound modulation. (a) Representative raw data of the EEG recording. (b) EEG signals decomposed to different frequency range by wavelet transform. (c) Statistics of the EEG peak amplitude as a function of frequency range before and after the ultrasound modulation. (d) Statistics of the EEG peak amplitude as a function of frequency before and after the ultrasound modulation with the ultrasound transducer moved 5 mm away. (e) Statistics of the peak amplitude for 0.3–0.7 Hz EEG signal with ultrasound of different intensity applied to awake mice. (f) Statistics of the peak amplitude for 0.3e0.7 Hz EEG signal with ultrasound of different intensity applied to anesthetized mice. *P < 0.05, **P < 0.01, ***P < 0.001.
