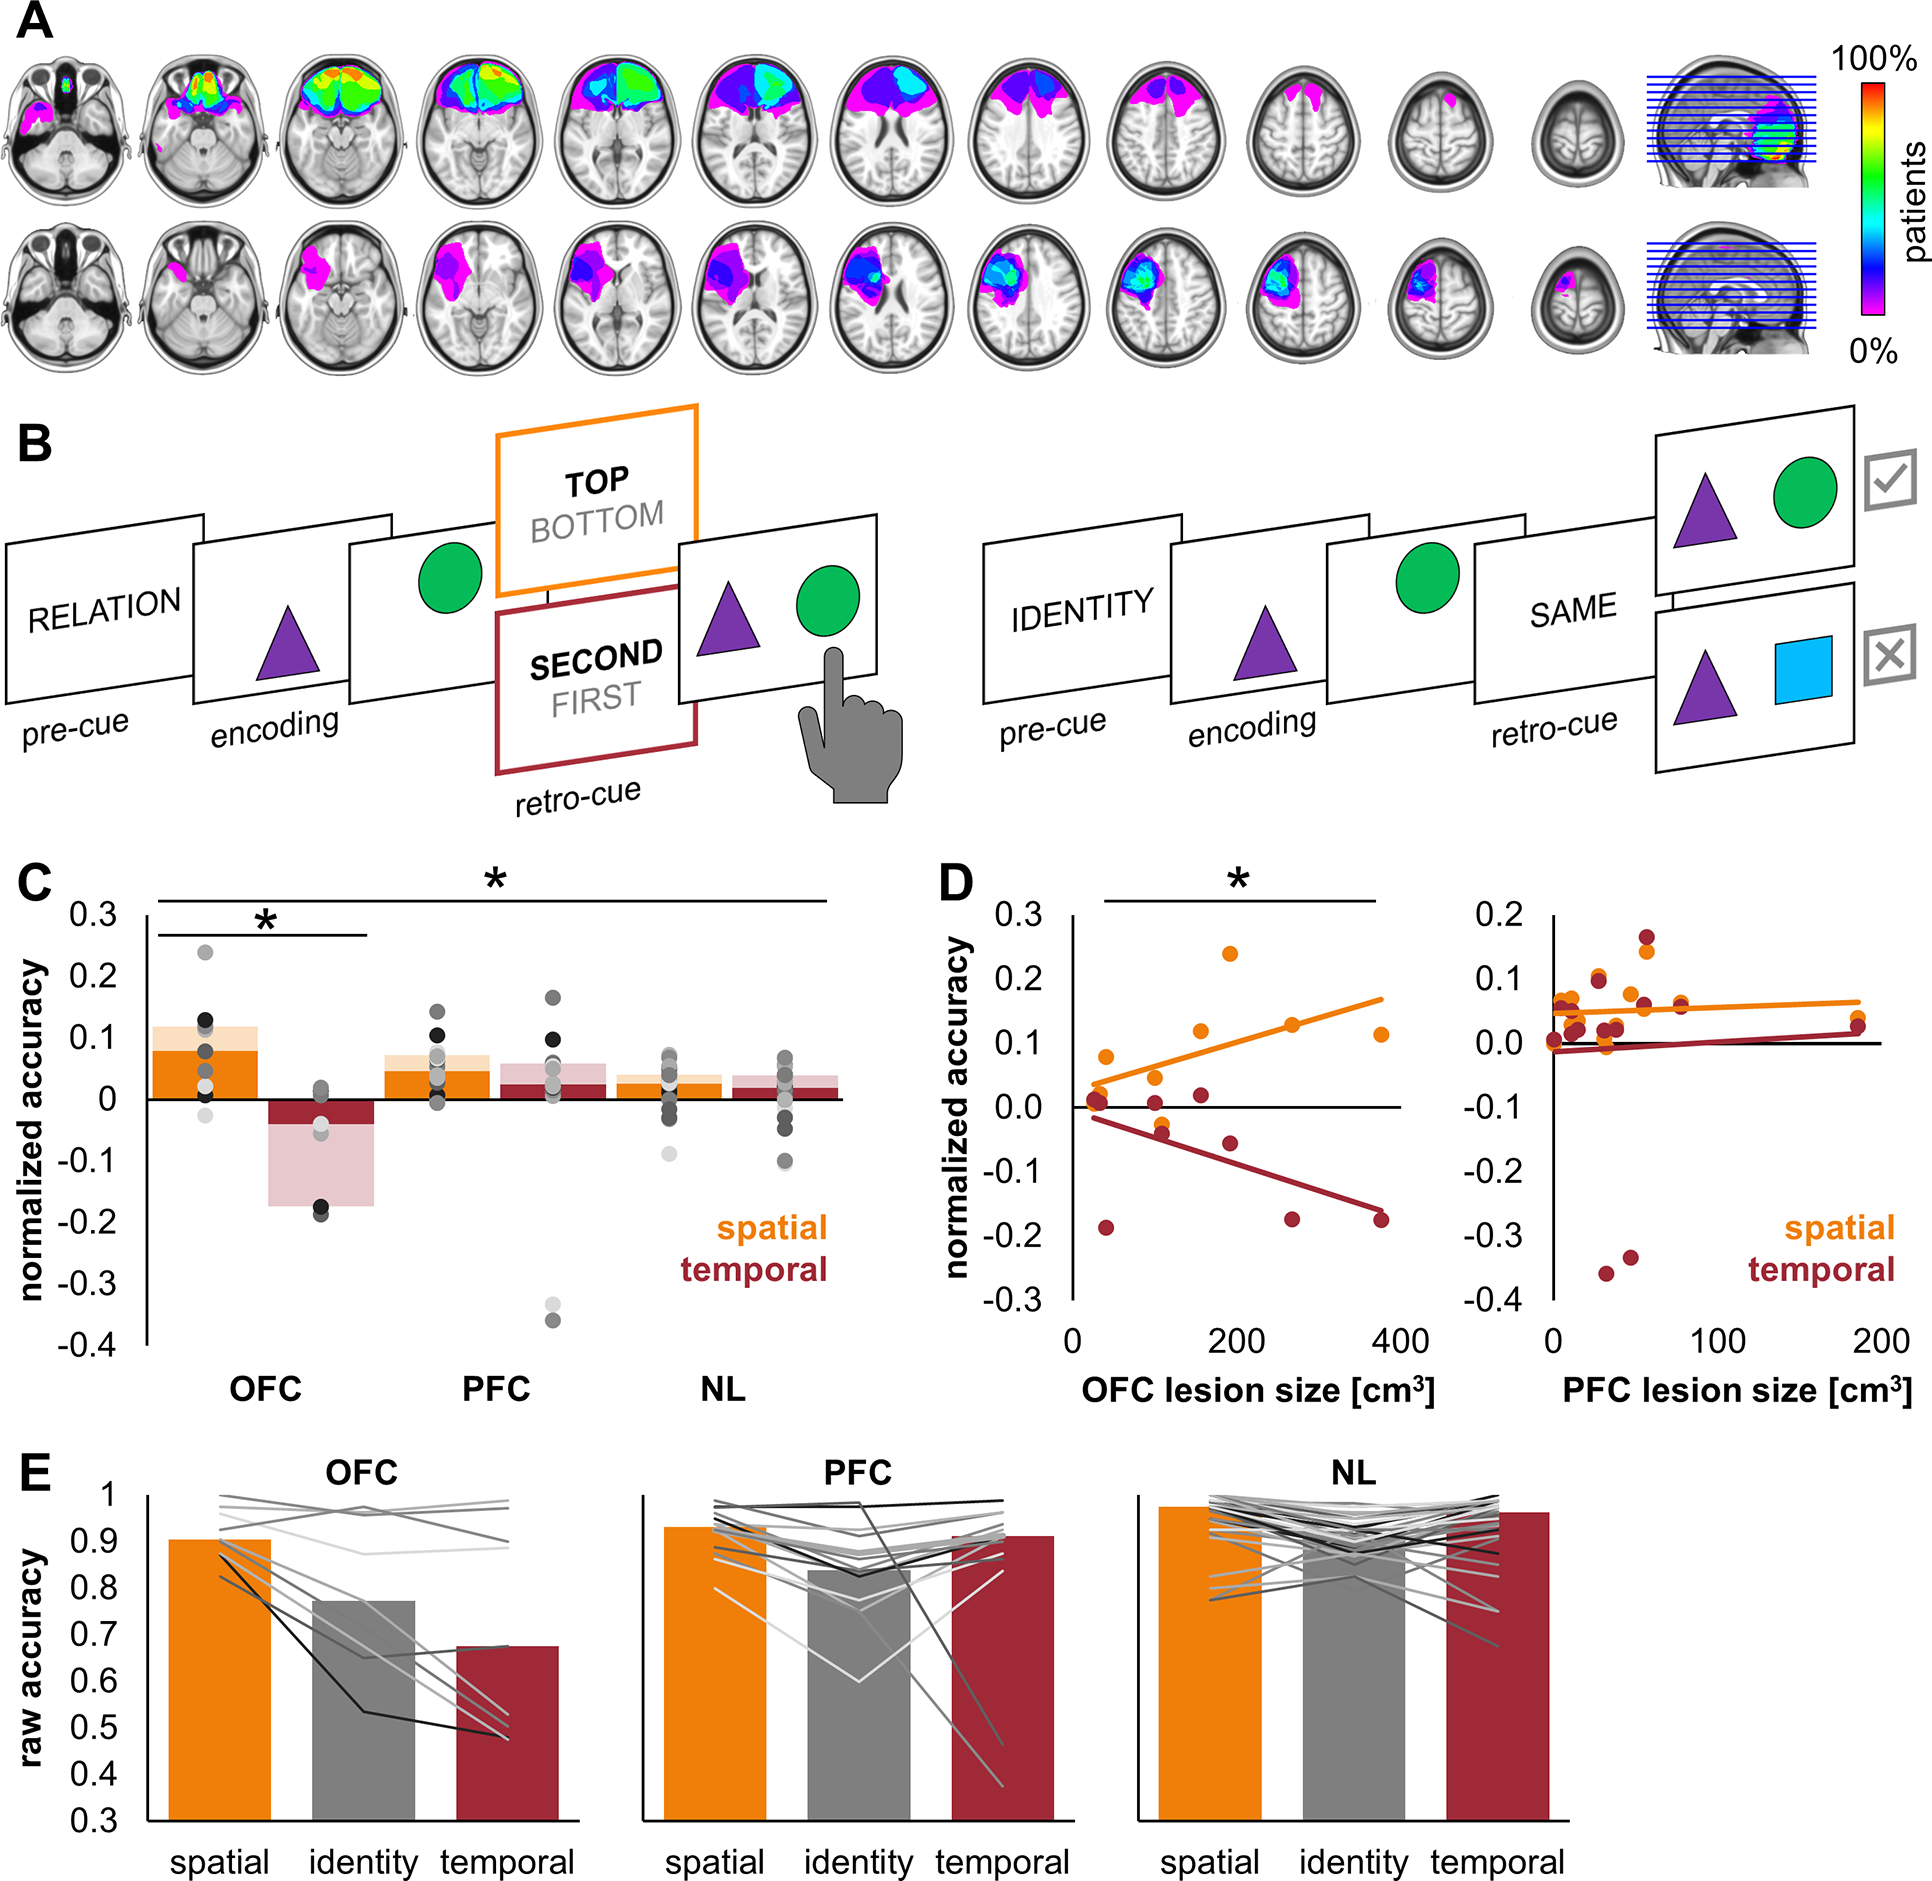
Figure 1. OFC lesions specifically reduce working memory for temporal order.

A) Lesion overlap for OFC (top; n = 9) and lateral PFC (bottom; n = 14) patients. PFC lesions are normalized to the left hemisphere5. Color scale, percentage of overlap across patients.
B) On each trial, subjects encoded a pair of stimuli in a specific spatiotemporal orientation and working memory was assessed in a two-alternative forced choice test (0.5 chance). The pre-cue and retro-cue designated trial type. On spatiotemporal relation trials (left), subjects indicated (by left or right keypress) which of two stimuli was in the top/bottom spatial or first/second temporal position. On identity trials (right), subjects indicated (by up/’yes’ or down/’no’ keypress) whether the pair was the same pair they just studied. Encoding stimuli were presented for 200 ms each, separated by 200 ms inter-stimulus fixation. The retro-cue was presented mid-delay, with 900–1,150 ms fixation before and after (not shown). The subsequent test was self-paced. Spatial, temporal, and identity trials were interspersed in random order.
C) OFC patients showed reduced accuracy for temporal order (red) but not spatial position (orange), compared to both PFC patients and NL controls. Points represent individual data and bars represent group median data (solid) ± 1 quartile spread (shaded). *, p < 0.001.
D) OFC lesion size predicted reduced accuracy for temporal order (red) but not spatial position (orange; left). PFC lesion size did not relate to individual accuracy (right). *, p < 0.001.
E) Data in (C) and (D) shown without normalization. Raw accuracy (proportion correct) for all trial types. Lines represent individual data and bars represent group median data.
