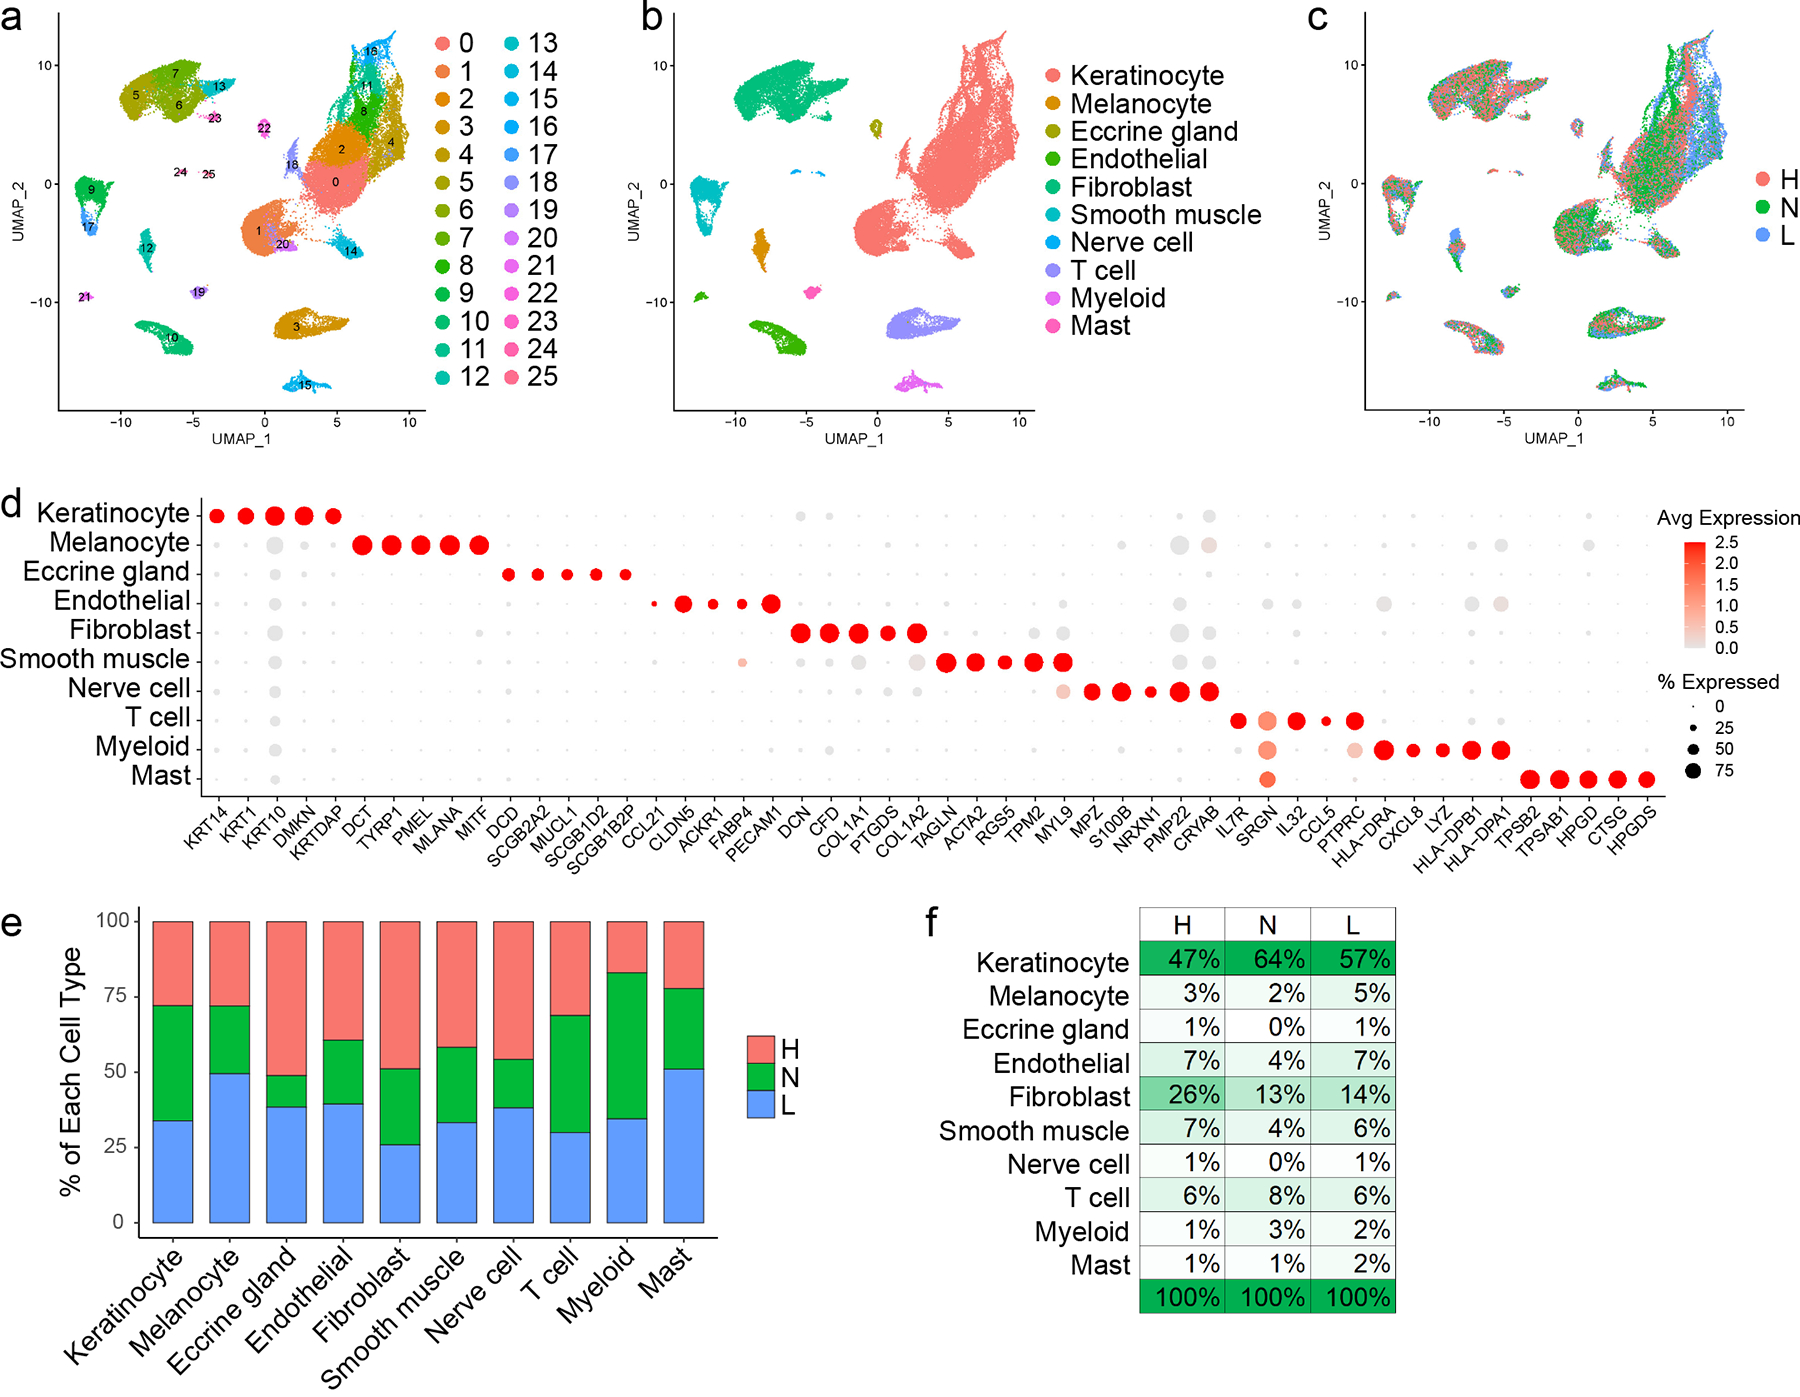
Figure 1. Single-cell RNA-sequencing (scRNA-seq) captures the cellular diversity within lesional and non-lesional skin of patients with cutaneous lupus erythematosus (CLE).

a. UMAP plot of 46,540 cells colored by cluster. b. UMAP plot of cells colored by cell type. c. UMAP plot of cells colored by disease state (H, healthy control skin; N, non-lesional lupus skin; L, lesional lupus skin). d. Dot plot of representative marker genes for each cell type. Color scale, average marker gene expression. Dot size, percentage of cells expressing marker gene. e. Bar plot showing the relative contribution of the three disease states to the total number of each cell type. Values are normalized to the total number of cells for each disease state. f. Composition of cells recovered for each disease state by cell type.
