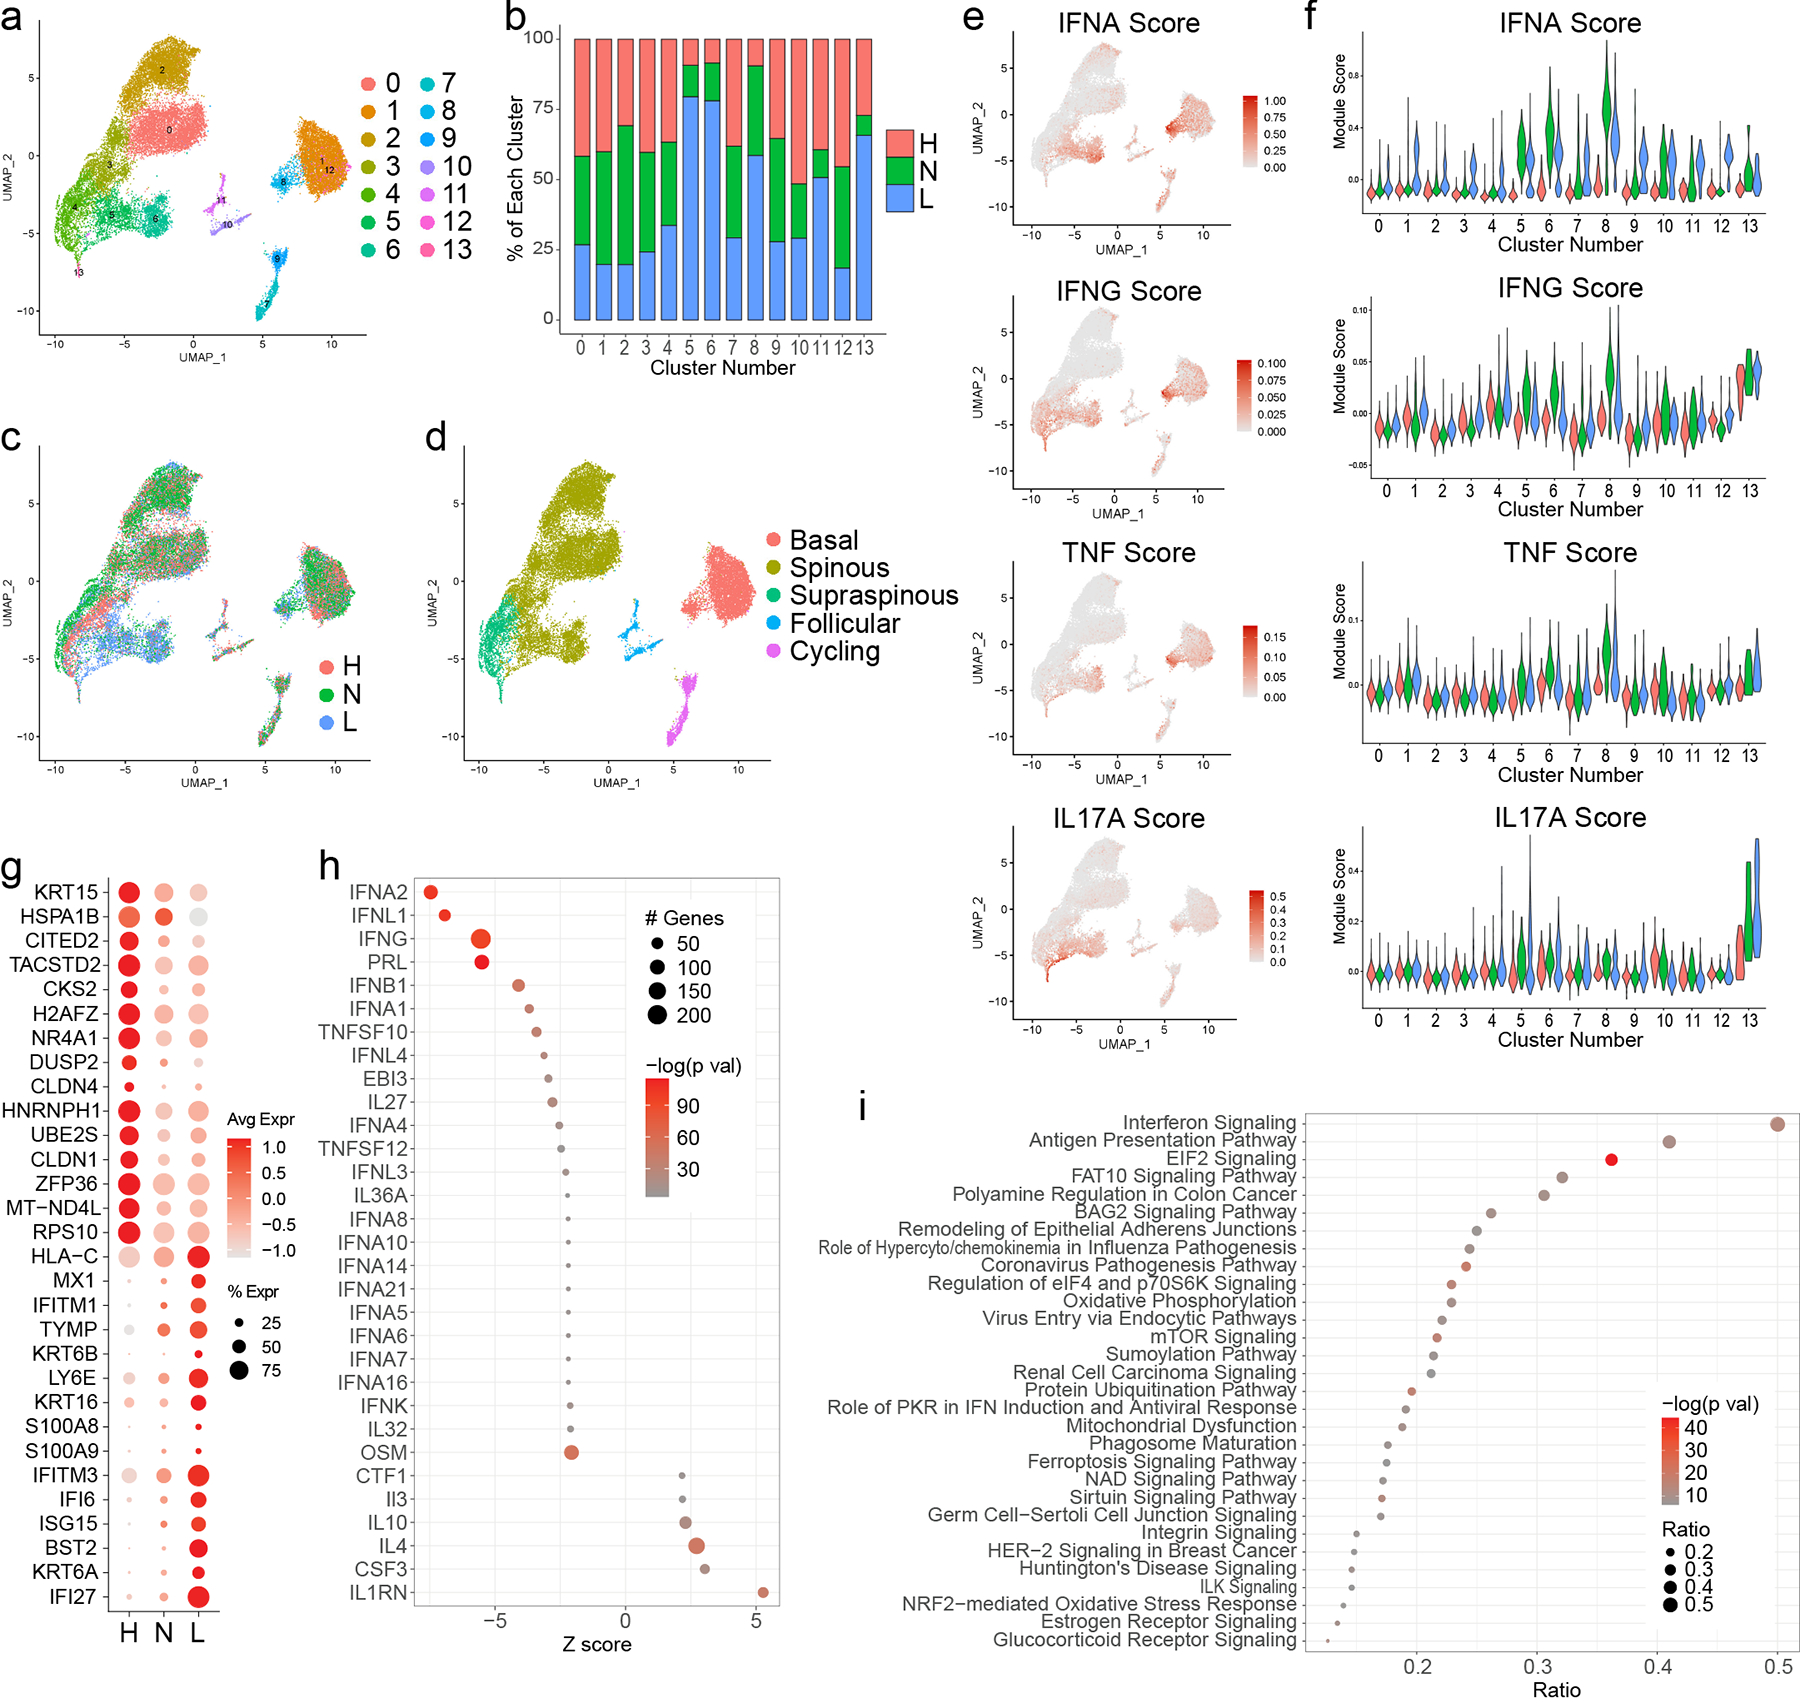
Figure 2. Interferon (IFN) responses shape the transcriptomic landscape of both lesional and non-lesional keratinocytes in patients with CLE.

a. UMAP plot of 25,675 keratinocytes (KCs) colored by sub-cluster. b. Bar plot of each KC sub-cluster showing the relative contribution of the three disease states. Values are normalized to the total number of KCs for each disease state. c. UMAP plot of KCs colored by disease state. d. UMAP plot of KCs colored by subtype. e. Feature plots of module scores for the indicated KC cytokine modules. f. Violin plots of KC scores for the indicated cytokine modules split by disease state. g. Dot plot of the top 15 differentially expressed genes (DEGs) downregulated and upregulated in L vs. H basal KCs. Color scale, average marker gene expression. Dot size, percentage of cells expressing marker gene. h. Dot plot of the top 30 upstream regulators enriched among DEGs in L vs. H basal KCs. Color scale, −log10(p value) from the enrichment analysis. Dot size, number of DEGs corresponding to each upstream regulator. Negative Z score, enriched in L; positive, enriched in H. i. Dot plot of the top 30 canonical pathways enriched among DEGs in L vs. H basal KCs. Color scale, −log10(p value) from the enrichment analysis. Dot size, ratio of [number of pathway genes among the DEGs]/[total number of pathway genes].
