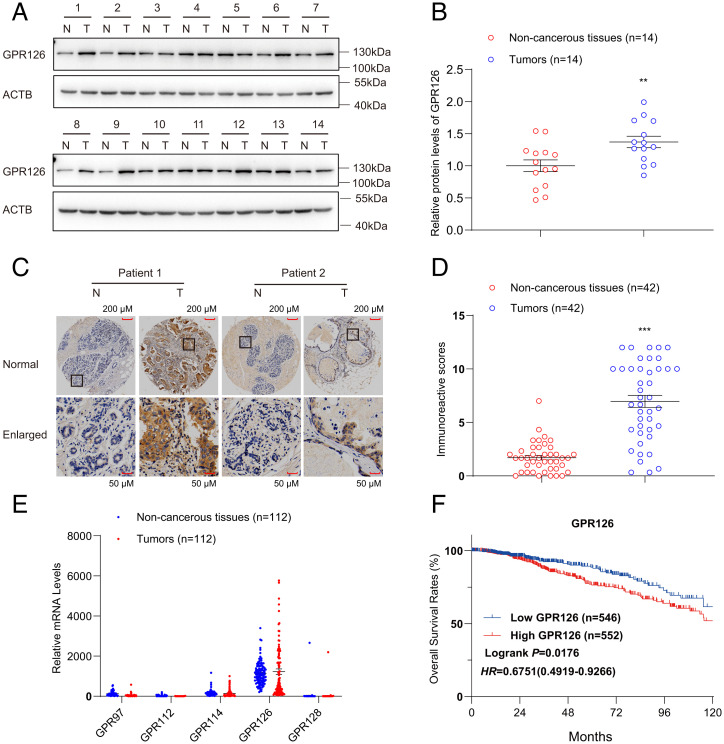
Fig. 4.
High GPR126 expression is observed in BC tissues and relates to a poor prognosis. (A and B) Western blot analysis of GPR126 in BC tissue (T) and adjacent nontumorous breast tissue (N). Fourteen representative paired samples were shown in A. The intensities of the immunoblot bands were quantified using ImageJ software and shown in B. The data are presented as the mean ± SEM from 14 paired patient samples and Student’s t test was used for comparisons between two groups. **P < 0.01. (C and D) IHC analysis of GPR126 in BC tissue (T) and adjacent nontumorous breast tissue (N). Two representative paired samples are shown in C. The statistic results showed that P < 0.001. The scale bar values were 0.216 for non-cancerous tissues and 0.566 for tumors (C). Immunoreactive score (IRS) of GPR126 in 42 paired BC samples were evaluated (D). The data are represented as the mean ± SEM and Student’s t test was used for comparisons between two groups. ***P < 0.001. (E) mRNA levels of GPR97, GPR112, GPR114, GPR126, and GPR128 in BC tissue (T) and adjacent nontumorous breast tissue (N) from 112 patients in TCGA database were calculated and analyzed. (F) Kaplan–Meier survival analysis of the relationship between GPR126 levels and the overall survival rates of breast cancer patients. The clinical data from 1,098 patients with breast cancer were analyzed and downloaded from TCGA database. High GPR126 expression was statistically associated with a shorter overall survival rate.

