Fig. 3.
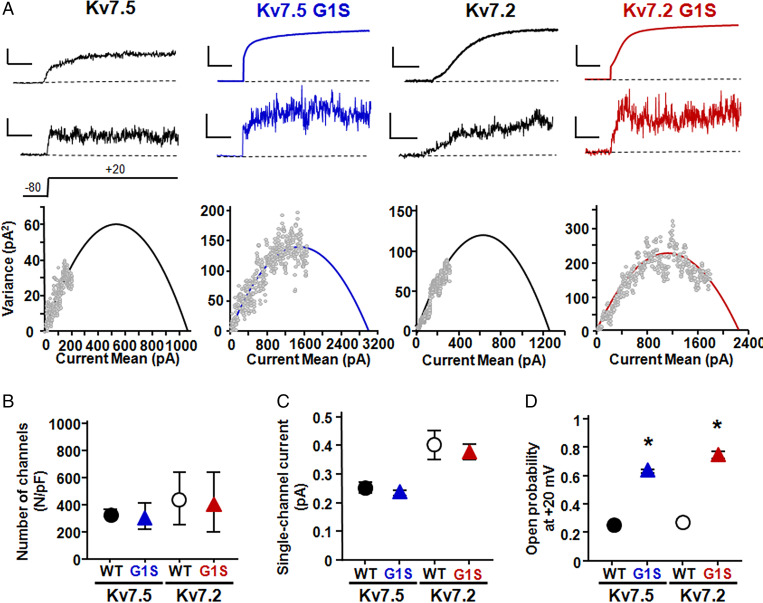
Nonstationary noise analysis of Kv7.5, Kv7.5 G1S, Kv7.2, and Kv7.2 G1S channels. (A) Representative average response to 100 pulses at +20 mV (Top), of the corresponding variance (Middle), and variance versus current mean plot (Bottom) from Kv7.5, Kv7.5 G1S, Kv7.2, and Kv7.2 G1S channels, as indicated. The continuous lines in Bottom are parabolic fits of the experimental data (Materials and Methods). Current and variance scales are 100 pA and 50 pA2 for Kv7.5, 750 pA and 100 pA2 for Kv7.5 G1S, 100 pA and 50 pA2 for Kv7.2, and 750 pA and 100 pA2 for Kv7.2 G1S. Time scale, 100 ms. Po and I estimates for the four cells shown were 0.18 and 0.20 for Kv7.5, 0.57 and 0.19 for Kv7.5 G1S, 0.25 and 0.38 for Kv7.2, and 0.79 and 0.39 for Kv7.2 G1S. (B–D) Quantification of the number of channels divided by capacitance (B), of the single-channel current (C), and of the opening probability at +20 mV (D). Asterisks indicate values significantly different (*P < 0.05) from respective controls (Kv7.5 channels, Left; Kv7.2 channels, Right).

